Unlock a world of possibilities! Login now and discover the exclusive benefits awaiting you.
- Qlik Community
- :
- Support
- :
- Support
- :
- Knowledge
- :
- Member Articles
- :
- Missing Manual - Top() and Bottom()
- Edit Document
- Move Document
- Delete Document
- Subscribe to RSS Feed
- Mark as New
- Mark as Read
- Bookmark
- Subscribe
- Printer Friendly Page
- Report Inappropriate Content
Missing Manual - Top() and Bottom()
- Move Document
- Delete Document and Replies
- Mark as New
- Bookmark
- Subscribe
- Mute
- Subscribe to RSS Feed
- Permalink
- Report Inappropriate Content
Missing Manual - Top() and Bottom()
![]() Have you ever wondered how the examples from the Qlikview help may look like?
Have you ever wondered how the examples from the Qlikview help may look like?
Please see below and enjoy responsibly...
Top() and Bottom()

Description
Returns the value of expression evaluated with the chart's dimension values as they appear on the last row of the current column segment in a table or, in the case of bitmap charts, in the chart's straight table equivalent.
If the chart is one-dimensional or if the expression is preceded by the total qualifier, the current column segment is always equal to the entire column.
If the table or table equivalent has multiple vertical dimensions, the current column segment will include only rows with the same values as the current row in all dimension columns except for the column showing the last dimension in the inter field sort order. The inter field sort order for pivot tables is defined simply by the order of the dimensions from left to right. For other chart types this can be manipulated in the Chart Properties: Sort dialog. ...
![]()
- Returns value from first (Top) or last (Bottom) row(s) per each group
Syntax:
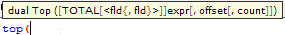
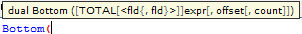
TOTAL[<fld{,fld}>]]expr - expression
offset - if greater that 0 will move the evaluation of expression to rows further down or above
count - this parameter will only works with Chart Range Function (like RangeSum), it will specify the numbers of rows to be taken for calculations.(Please see last example)
Data Model:
(Copy and Pasted below code into Edit Script window and reload)
LOAD * inline
[
Year ,Month ,Sales
2015 ,January, 10
2015, February,20
2015 ,March ,30
2014 ,January ,40
2014 ,February,50
2014 ,March ,60
2013 ,January ,70
2013 ,February ,80
2013 ,March,90
]
Let's build a Straight Table with Year and Month as dimensions and expressions as below:
Example 1:
The left hand side shows use of sum(Sales) the right hand side result from our new expression.
sum( Sales ) -----------> bottom(sum( Sales ) )
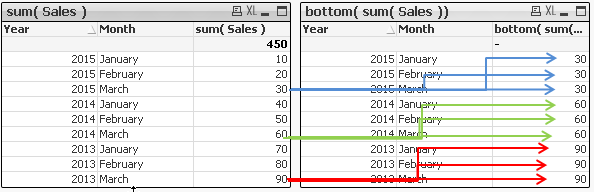
For each row the returned value is the same as the bottom value for this group: 30,60.90
sum( Sales ) -----------> top(sum( Sales ) )
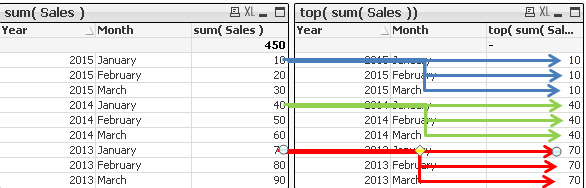
For each row the returned value is the same as the bottom value for this group: 10,40,70.
Example 2
By specifying the second criteria as 2 , the returning value is the second value from the top or bottom of each group.
In this example top and bottom are giving the same result (the middle value) as we have 3 data points for each group
sum( Sales )-----------> top sum( Sales ), 2 )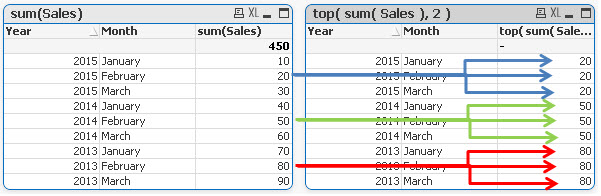 sum( Sales )-----------> bottom( sum( Sales ), 2 )Example 3
top(TOTAL sum( Sales ) ) bottom(TOTAL sum( Sales ) )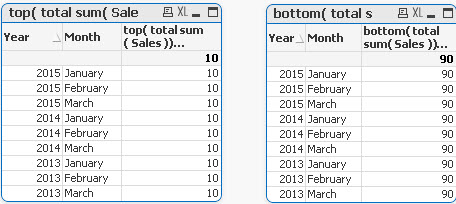 Adding TOTAL before Sum will result with the first or last value to be assigned to all rows.(Total will ignore dimension)
Example 4
RangeAvg() takes 3 parameters-
expression ---> Top/Bottom(sum(Sales),
-offset of rows--->1-
number of rows to sum--->2
sum(Sales) rangeavg (Top(sum(Sales),1,2))
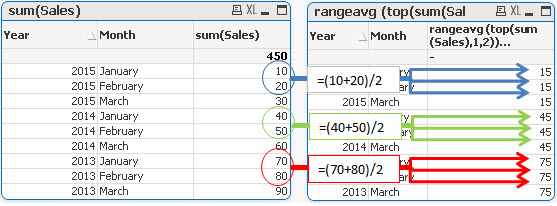
For each group in right table:
- Each row is average of values from two top rows for each group (first we are moving 1 row above current row and then adding 2 rows)
sum(Sales) rangeavg (Bottom(sum(Sales),1,2))
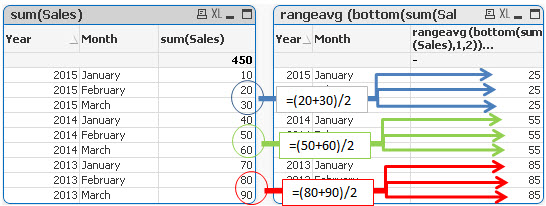
For each group in right table:
- Each row is average of values from two bottom rows for each group (first we are going 1 row down current rowand then adding 2 rows)
Still feeling hungry?
Do you Qualify?- How to use QUALIFY statement
Missing Manual - GetFieldSelections() + Bonus Example
MaxString & MinString - How to + examples
The second dimension... or how to use secondarydimensionality()
Missing Manual - Below() and Above()
- Move Comment
- Delete Comment
- Mark as Read
- Mark as New
- Bookmark
- Permalink
- Report Inappropriate Content
Nice one 