Unlock a world of possibilities! Login now and discover the exclusive benefits awaiting you.
- Qlik Community
- :
- Forums
- :
- Analytics
- :
- QlikView
- :
- Documents
- :
- QlikView UK Maps
- Subscribe to RSS Feed
- Mark as New
- Mark as Read
- Bookmark
- Subscribe
- Printer Friendly Page
- Report Inappropriate Content
QlikView UK Maps
- Mark as New
- Bookmark
- Subscribe
- Mute
- Subscribe to RSS Feed
- Permalink
- Report Inappropriate Content
QlikView UK Maps
Sep 21, 2022 5:11:51 PM
Oct 12, 2018 10:01:05 AM
Introduction
The purpose of this document is to introduce a set of tools to generate maps for the UK to be used in QlikView through an extension. There are already other solutions that address this but I couldn’t find any free; now google has also changed the access to their api so also that isn’t free anymore.
Through this document I’ll explain how to generate KML maps at various levels of detail to be then used with the quickmap extension created by Brian Munz (https://github.com/brianwmunz/QuickMap-QV11); this extension uses openstreetmap so it is free. Also, I’m providing an example to show how to implement it.
High level overview
There is a wealth of data available in the UK; I started this project when analysing the house price paid data available from the Land Registry. The data is very well structured and every transaction has an associated postcode, so that is the starting point for the visual representation: reference lookup data is available with postcode coordinates as well as the details of which geographical areas it belongs to.
There are multiple geographical levels in the UK and KML maps are available to download; the challenge with these maps is that they are extremely large to be loaded in one single instance by the extension. What I’ve done is to break down these maps in smaller areas and to establish two drilldown paths:
- 1. European Electoral Regions (EERCode) > Local authority district (DistrictCode) > Middle layer super output areas (MSOACode) > Lower layer super output areas (LSOACode) > Output areas (OACode)
- 2. Local authority district (DistrictCode) [lower resolution map] > Middle layer super output areas (MSOACode) > Lower layer super output areas (LSOACode) > Output areas (OACode)
Different drilldown paths can be set up in the application and the relevant maps generated.
I’ve created 4 QlikView applications:
- UKMaps_Coordinates_Generator: takes the KML maps and saves them into QVD files
- UKPostcodesLookup_generator: loads postcodes reference and saves them into QVD files
- UKMaps_Creator: loads the QVD files created by the generator and creates the map files required by the quickmap extension
- UKMaps_VisualizationExample: example implementation
I’ve included within the applications all the relevant instructions on how to use them.
The whole package is included in the zip file attached; I’ve also included an amended version of the quickmap extension: I’ve added some extra functionalities (ability to define max and min values and possibility to use a color gradient with smooth transitions) so please use this version. Within the qar file I’ve also already embedded the maps required by the example application.
Sample drilldown screenshots
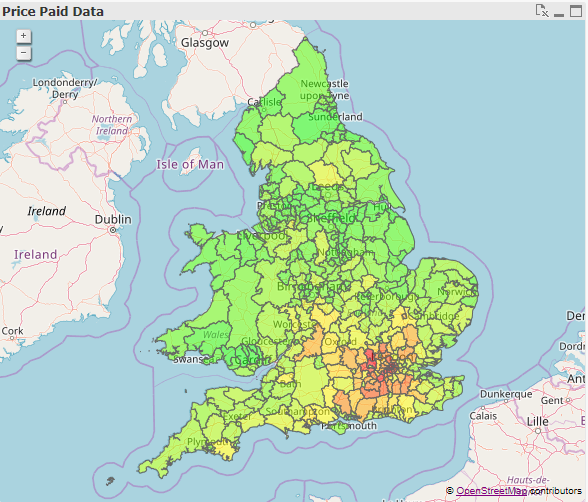
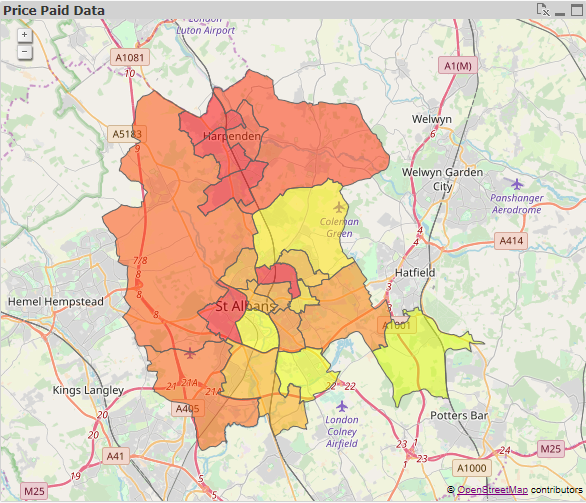
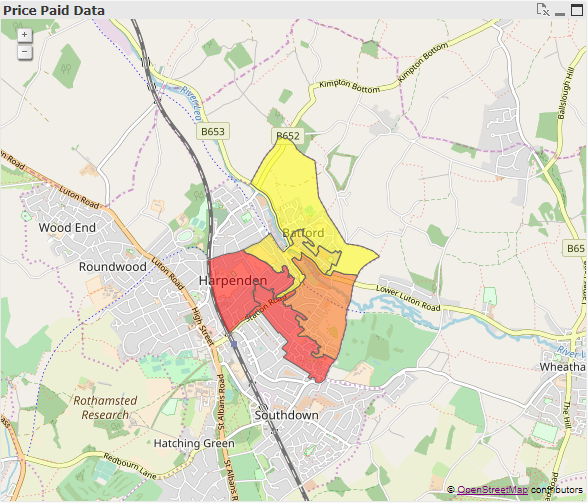
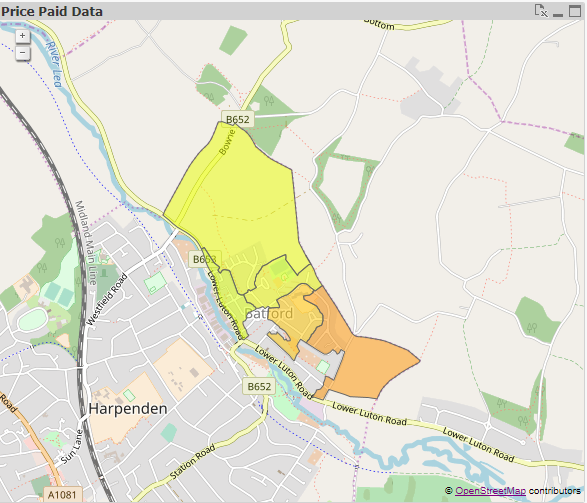
In this example you can see that, as you select the data and drill down, different sets of maps are used for each level that contain progressively more details.
England and Wales district overview:

St Albans District:

MSOA Level - St Albans 002

LSOA level - St Albans 002C

OA level (coordinates) - OA E00120299
![Price paid data - OA [coordinates].png](/legacyfs/online/215784_Price paid data - OA [coordinates].png)
I hope someone might find this helpful. I would appreciate any comments or feedback.
- Mark as Read
- Mark as New
- Bookmark
- Permalink
- Report Inappropriate Content
this extension is superb and has changed my whole app roach to what i do, i used to say it's not the targets that count, but the counting and the measuring, i have changed my mhind, thank U so much L, it's not the targets that count, but the counting, the measuring AND the mobilITy - a national approach IS required, that is only right and proper, i believe the DoH puts patients first, as do I, unless non party political leaders start to be be far more honest about the fact that it is the IT that will make our NHS more efficient then there is no chance, let me be more precise the NHS needs technical as much as clinical and far more than managerial ... recruit more techies, it does not matter about their gender or any other demog, thank you L for all your ... work