Unlock a world of possibilities! Login now and discover the exclusive benefits awaiting you.
- Qlik Community
- :
- All Forums
- :
- QlikView Integrations
- :
- Google Maps - Cluster
- Subscribe to RSS Feed
- Mark Topic as New
- Mark Topic as Read
- Float this Topic for Current User
- Bookmark
- Subscribe
- Mute
- Printer Friendly Page
- Mark as New
- Bookmark
- Subscribe
- Mute
- Subscribe to RSS Feed
- Permalink
- Report Inappropriate Content
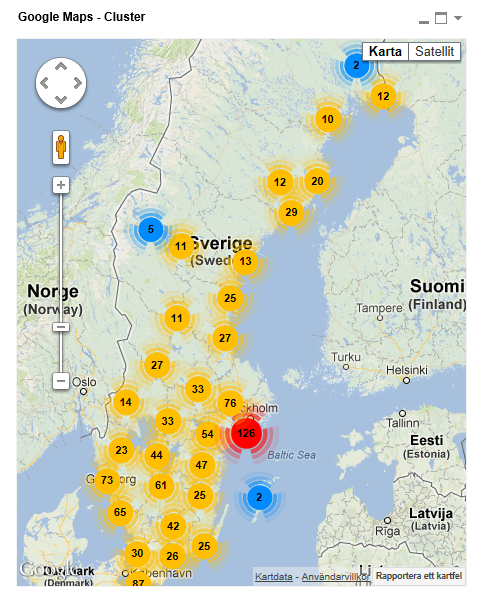
Google Maps - Cluster
Google Maps Extension with Cluster support.
QlikTech takes no responsibility for any code and QlikTech Support Agreement does not cover issues with this extension.
Please review Googles license agreement before you put this into production.
Introduction
This is a QlikView extension object that integrates Google Maps Javascript API V3 and a third party library called MarkerClusterPlus into QlikView.
Load a set a coordinates into QlikView and visualize them together with this extension. The clustering feature is create when you have alot of data points and needs to group/cluster them together for greater visability and performance.
The maxzoom property defines at what zoom level you want your markers clustered. The grid size property controls how big or small cluster grid size you want.
You can either use the extension 'as is' or use it as a base to further customize it to fit your needs.
Download the extension and view source code at: https://github.com/mindspank/GoogleMaps-Cluster-QV11
If you build something awesome please share it with the community!
Live long and prosper.
2015-02-15
Removed download from post, please grab the latest version from Github instead.
2014-02-03
Various fixes.
2014-01-09
There has been numerous upgrades to the extension.
Now clusters now display the value of your expression and with added support to include more information in pop-up labels.
Example grayscale styled map included.
Possibility to show only a single cluster icon style if you do not want it to scale according to the number of markers in the cluster.
2013-06-17
Added custom marker support. Now you can specify a url for an custom marker. Accepts all major image file types.
- Mark as New
- Bookmark
- Subscribe
- Mute
- Subscribe to RSS Feed
- Permalink
- Report Inappropriate Content
Hi Alexander
This is something I also wish for:
"But controlling the number in the image and color should be doable. I'll look into it and get back to you."
Is it possible to do somehow?
- Mark as New
- Bookmark
- Subscribe
- Mute
- Subscribe to RSS Feed
- Permalink
- Report Inappropriate Content
Yes, I have a version where you can control the number on the cluster. However I'm a bit torn on the color/cluster image and size.
Should that follow your expression or just stay a static color? And if it follows your expression and you have a outlier in your data it's going to skew the cluster colors
Kind Regards
Alexander Karlsson
- Mark as New
- Bookmark
- Subscribe
- Mute
- Subscribe to RSS Feed
- Permalink
- Report Inappropriate Content
Hi, In my application I would prefer it to follow the expression. Im going to show the number of packages sent, and I dont think an outlier should be a problem i my case. If I understand you correctly. Would love the possibility to do this! Thanks
- Mark as New
- Bookmark
- Subscribe
- Mute
- Subscribe to RSS Feed
- Permalink
- Report Inappropriate Content
What happens if you have large number of geo points (tens of thousands), does qlikview/extension try to group them in some logical way, or will it crash the app (or crunch the data for two hours)?
Also, I have a huge number of adresses and I am thinking is it possible to geocode them just by zip code and then only if I actually select single one then geocode it on the fly and show its exact position on the map? (in order to avoid geocoding 200.000+ adresses)
- Mark as New
- Bookmark
- Subscribe
- Mute
- Subscribe to RSS Feed
- Permalink
- Report Inappropriate Content
I have "plotted" 200k markers with 2 second response time which was ok.
However once you get to that amount of individual points they usually stop making sense and some other form of geographical mapping would be more interesting for you. But if you need to display exact location data for 200 000 data points then this extension should do most of the heavy lifting for you.
Simplified this is how the extension works.
- QlikView server sends the max number of rows of data as defined in definition.xml to the client/extension.
- The extension will create a Longitude Latitude object for every row.
- Once that is done all of the markers are handed over to the clustering algorithm which puts every marker into different bins depending on grid size.
- Draws the different cluster groups onto the screen.
Also simplified but 90% of the time spent by any webapp are caused by javascript talking with the DOM api - not javascript iterating over 200k rows of data.
I would recommend that you check out the svgMap posted on QlikCommunity by Brian Munz also. There you could heat map zip codes/states/areas/whatever and once you get to transactional level have a marker map popping up showing the individual locations.
- Mark as New
- Bookmark
- Subscribe
- Mute
- Subscribe to RSS Feed
- Permalink
- Report Inappropriate Content
Hi again Alexander,
Could you upload the version where you can control the number on the cluster? Would be very thankful.
- Mark as New
- Bookmark
- Subscribe
- Mute
- Subscribe to RSS Feed
- Permalink
- Report Inappropriate Content
hi
How can i display images stored in local folder in map pop ups
- Mark as New
- Bookmark
- Subscribe
- Mute
- Subscribe to RSS Feed
- Permalink
- Report Inappropriate Content
Hi,
Need one more help
i am using Google map cluster extension. I have requirement in this extension to move next sheet upon user clicks on point of maps. I have checked script.js where we have onclick event listener but I dont have code to active next can you please share the code.
Thanks
Ramu Vanparty
- Mark as New
- Bookmark
- Subscribe
- Mute
- Subscribe to RSS Feed
- Permalink
- Report Inappropriate Content
You don't need to change the extension for that. Set a OnSelect trigger for the latitude field and a activate sheet action.
You can find the options below document settings.
Kind Regards
Alexander Karlsson
- Mark as New
- Bookmark
- Subscribe
- Mute
- Subscribe to RSS Feed
- Permalink
- Report Inappropriate Content
You can't. You need something to serve up the images over the web for you.
Typically the same webserver hosting the Ajax client would do.
Kind Regards
Alexander Karlsson