Unlock a world of possibilities! Login now and discover the exclusive benefits awaiting you.
- Qlik Community
- :
- All Forums
- :
- QlikView Integrations
- :
- Re: Google Maps - Marker
- Subscribe to RSS Feed
- Mark Topic as New
- Mark Topic as Read
- Float this Topic for Current User
- Bookmark
- Subscribe
- Mute
- Printer Friendly Page
- Mark as New
- Bookmark
- Subscribe
- Mute
- Subscribe to RSS Feed
- Permalink
- Report Inappropriate Content
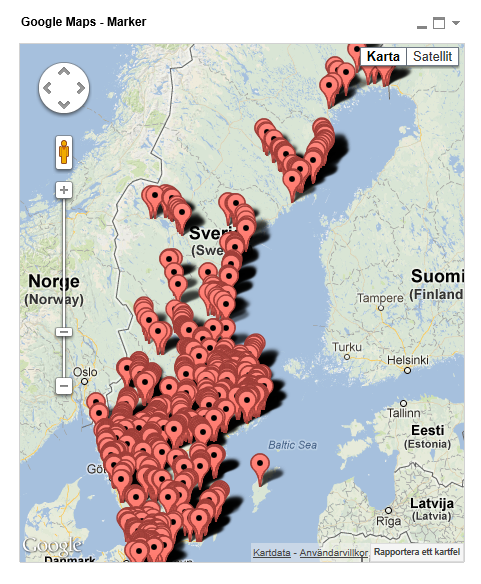
Google Maps - Marker
Google Maps Extension with Markers.
QlikTech takes no responsibility for any code and QlikTech Support Agreement does not cover issues with this extension.
Please review Googles license agreement before you put this into production.
Introduction
This is a QlikView extension object that integrates Google Maps Javascript API V3 into QlikView.
Load a set a coordinates into QlikView and visualize them together with this extension. This extension will plot every single data point as a marker on the map so if you have a large amount of markers please be aware that it might have some performance impact. If you are experiencing performance issues look into the cluster extension instead: http://community.qlik.com/message/325640
You can either use the extension 'as is' or use it as a base to further customize it to fit your needs.
Custom Markers
Added support for custom markers images. In the properties dialog you now have the option to specify a custom image.
You can either have a static image or let the expression evaluate one for you, for example:
=If(MyExpression > 1, 'http://image_for_true', 'http://image_for_false'). If you do not specify an url or enter an invalid one the extension will fallback to the standard marker.
Supported image extensions are bmp, jpg, jpeg, tiff, png and gif.
You can host the images through the qlikview webserver or through IIS.
If you build something awesome please share it with the community!
Live long and prosper.
- Mark as New
- Bookmark
- Subscribe
- Mute
- Subscribe to RSS Feed
- Permalink
- Report Inappropriate Content
Alexander,
sorry for the stupid question but, can I use cluster map extension to see different sized bubbles based on some calculated measure? (maybe I haven't understood... but it seems a so simple problem....).
Mark
- Mark as New
- Bookmark
- Subscribe
- Mute
- Subscribe to RSS Feed
- Permalink
- Report Inappropriate Content
No, this extension groups points into clusters to help with both performance and display when you have a large number of markers.
Instead you might want to take a look at the extension that ships with SR5 and above, http://community.qlik.com/blogs/qlikviewdesignblog/2013/12/20/qlikview-112-sr5-and-maps
- Mark as New
- Bookmark
- Subscribe
- Mute
- Subscribe to RSS Feed
- Permalink
- Report Inappropriate Content
Hi,
I'm trying to implement this into my Qlikview-dashboard.
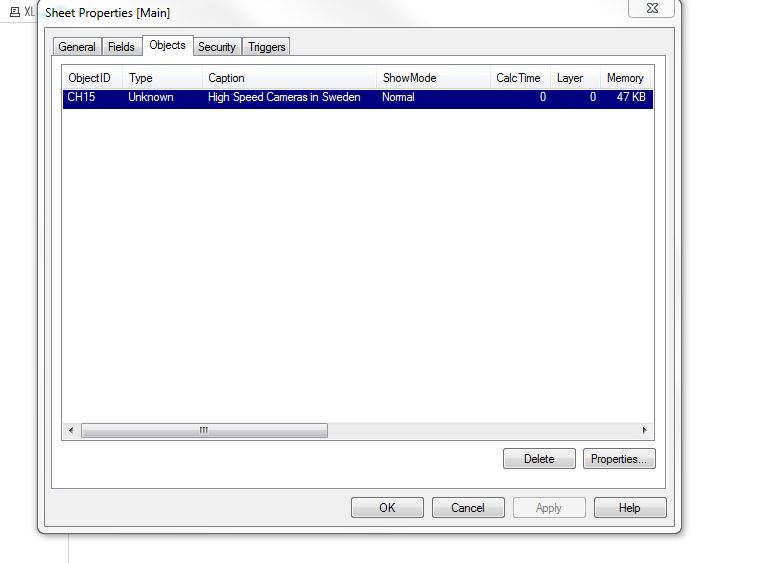
But if I right-qlik on the object I Can't select properties...
If I go to settings -> Sheet properties I can select the object and change it.
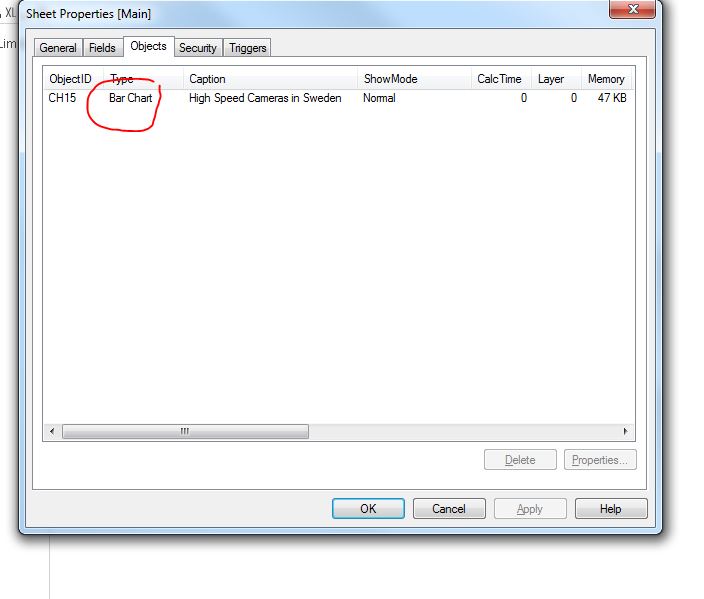
But then the object-type changes from Unknown to bar-chart and tha map isn,'t working anymore.
I've just installes QV 11.2 SR7
- Mark as New
- Bookmark
- Subscribe
- Mute
- Subscribe to RSS Feed
- Permalink
- Report Inappropriate Content
You cannot edit your extension with Desktop mode (the button "Properties" is disabled when you right click on the object) if you do it in Desktop mode QlikView will select automatically a type for your object (to Unknow to the selected Chart ) and then the extension will not work anymore.
To edit it you need to go in "WebView" mode (it's a button available in conception mode on QlikView Desktop) and after you can access the dimension/expression of your extension.
- Mark as New
- Bookmark
- Subscribe
- Mute
- Subscribe to RSS Feed
- Permalink
- Report Inappropriate Content
Thanx Alexander. These maps are working fine.
I have a little question about the zoom.
If I have a lot of data-points the zoom is really good.
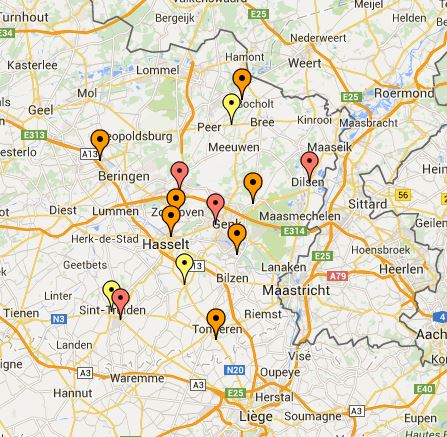
But if I select 1 data-point the zoom is little bit to large.
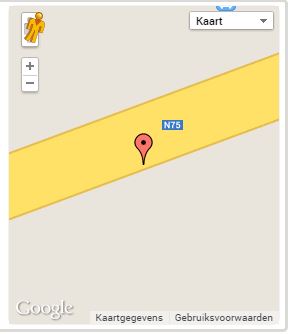
If possible I would lik to see something like this when I select 1 data-point.
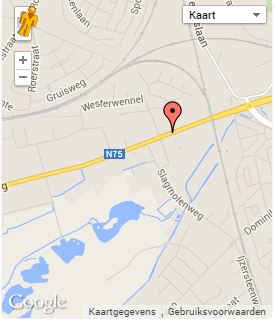
Is this possible and how can I manage this?
Regards,
Kris
- Mark as New
- Bookmark
- Subscribe
- Mute
- Subscribe to RSS Feed
- Permalink
- Report Inappropriate Content
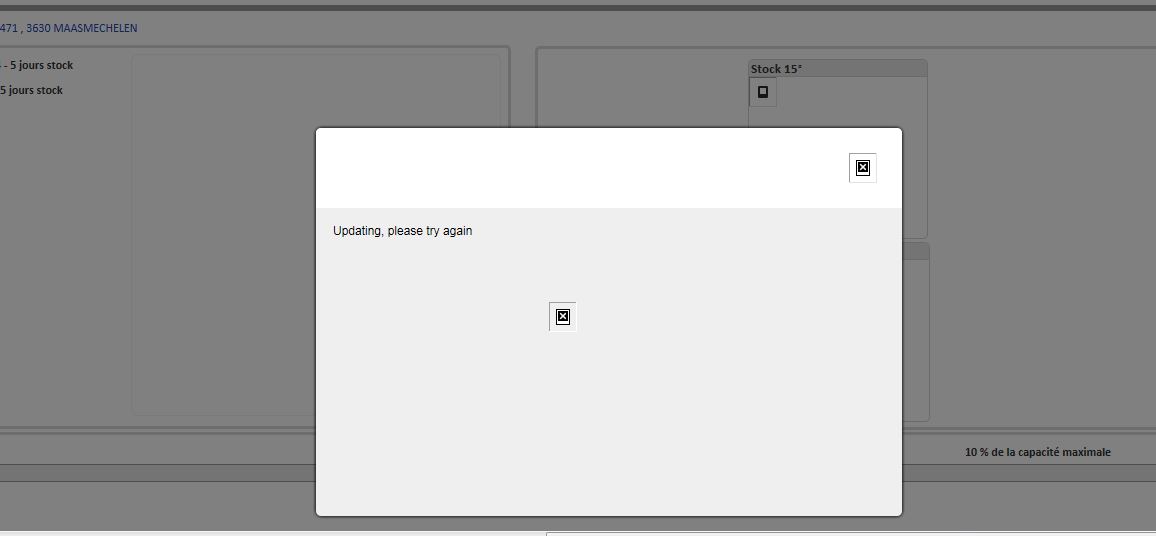
We are working with your maps and the users are verry happy with it.
But we often get this message. It stays a few secconds and then dissapear.
Is there anything I can do to let this message dissappear?
Regards,
Kris
- Mark as New
- Bookmark
- Subscribe
- Mute
- Subscribe to RSS Feed
- Permalink
- Report Inappropriate Content
Thanx for your answer. You need to go in the webview!
🙂
- Mark as New
- Bookmark
- Subscribe
- Mute
- Subscribe to RSS Feed
- Permalink
- Report Inappropriate Content
Hi Alex,
Can you please share the QAR , as i am having the same requirement in my project and the extension i am having doesnt have custome marker feature available on it , please assist on the same.
- Mark as New
- Bookmark
- Subscribe
- Mute
- Subscribe to RSS Feed
- Permalink
- Report Inappropriate Content
The first post in this thread has a link where you can download it
Kind Regards
Alexander Karlsson
- Mark as New
- Bookmark
- Subscribe
- Mute
- Subscribe to RSS Feed
- Permalink
- Report Inappropriate Content
Hi, I wonder how could insert two different markers , ie , one for employees and one for the place where they work, two different markers.
Thanks.
Regards.