Unlock a world of possibilities! Login now and discover the exclusive benefits awaiting you.
- Qlik Community
- :
- All Forums
- :
- QlikView Integrations
- :
- Re: New QlikView Mapping Extensions on QlikMarket
- Subscribe to RSS Feed
- Mark Topic as New
- Mark Topic as Read
- Float this Topic for Current User
- Bookmark
- Subscribe
- Mute
- Printer Friendly Page
- Mark as New
- Bookmark
- Subscribe
- Mute
- Subscribe to RSS Feed
- Permalink
- Report Inappropriate Content
New QlikView Mapping Extensions on QlikMarket
EDIT: These extensions are no longer maintained on QlikMarket since that is not an appropriate place for free and unsupported extensions. I've modified the links below to point to the github repositories where I now keep them. Also, since they're now hosted on github, feel free to make contributions to the code.
Hi everyone,
The demand for mapping in QlikView seems to be a hot topic these days, so I’ve put together two extensions that are now available on QlikMarket bearing the QlikView name.
The first one is an extension which uses SVG images to connect to the data and color and shade the regions in that image:
brianwmunz/svgReader-QV11 · GitHub
Similar to this map of US Counties:
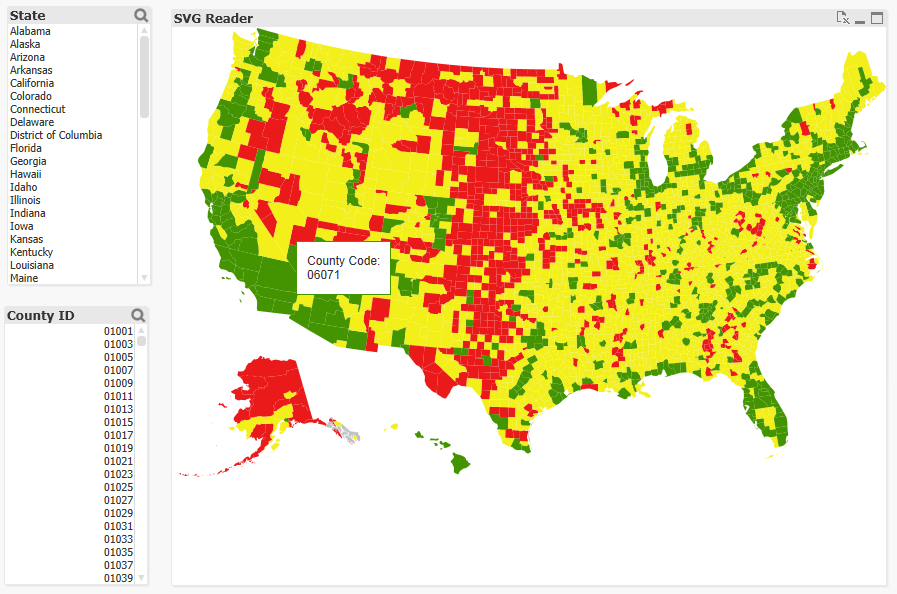
There’s no geospatial connection here (long/lat points can’t be plotted, etc.), but it should prove useful for a lot of simple needs and uses for visualization of a geographical entity. It comes prepackaged with 35 or so maps of countries, etc. and also offers the ability to load in your own custom SVGs for things like floor plans, seating charts, etc.
The second extension is a simple geospatial mapping extension similar to the Google Maps and various other extensions you might have seen in community:
brianwmunz/QuickMap-QV11 · GitHub
This extension simply takes geographic data (longitude/latitude points) from QlikView and draws it over a map. It supports the drawing of dots, lines, or polygon shapes. For example:
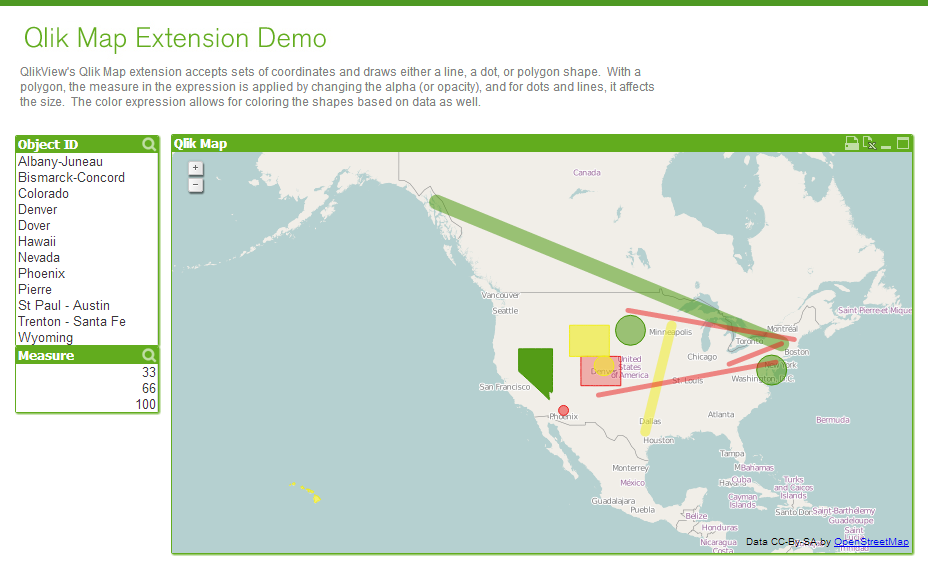
This doesn’t offer near the capabilities of a server based geospatial mapping solution like ESRI, GeoQlik, Idevio, etc. simply because it’s not server side, but it should be helpful for less heavy and complex mapping needs.
Anyway, I hear a lot about need for mapping so I thought I’d let everyone know.
- Mark as New
- Bookmark
- Subscribe
- Mute
- Subscribe to RSS Feed
- Permalink
- Report Inappropriate Content
Brian,
This may be slightly off topic to here, but directly related to your map work previously. Would it be possible to have a custom kml/xml/svg of personally defined regions and apply a tag that would be related to our internal regions? Also once we have that map source defined would it be possible to have either google maps or Openstreet to define locations/markers that appear on the map with the overlay of the custom defined region kml?
Thank you,
Andrew
QV 11.011440.0 SR2
IE 8
- Mark as New
- Bookmark
- Subscribe
- Mute
- Subscribe to RSS Feed
- Permalink
- Report Inappropriate Content
Hi Brian,
I am having the same problem as michael. I have a SVG file with all the sates correctly named to be linked with the data, but I only have the borders that show data (when hovering), I don't have any color to fill in the states, and any expression I put into 'color expression' is just ignored.
Do you have any idea of what can be going wrong?
Thanks,
Victor
- Mark as New
- Bookmark
- Subscribe
- Mute
- Subscribe to RSS Feed
- Permalink
- Report Inappropriate Content
What qlikview version are you using? 11 SR1?
- Mark as New
- Bookmark
- Subscribe
- Mute
- Subscribe to RSS Feed
- Permalink
- Report Inappropriate Content
Thanks for the quick response.
Yes, I'm using the 11 SR1. Is there an issue with it?
- Mark as New
- Bookmark
- Subscribe
- Mute
- Subscribe to RSS Feed
- Permalink
- Report Inappropriate Content
Yes unfortunately extensions don't really work in SR1. If you upgrade it should all work.
- Mark as New
- Bookmark
- Subscribe
- Mute
- Subscribe to RSS Feed
- Permalink
- Report Inappropriate Content
Thanx a lot, it works perfectly with SR3!
- Mark as New
- Bookmark
- Subscribe
- Mute
- Subscribe to RSS Feed
- Permalink
- Report Inappropriate Content
Hi Brian
The latest version is working great - including resizing of the map. One suggestion: would it be possible for an expression to be used in the configuration for both the field used to map to the regions and the map file used? Then we could construct a drill down from the world map to country. Eg.
On the field:
=if(count(CountryCode)<>1, CountryCode, StateCode)
On the Map:
=if(count(CountryCode)<>1, 'World', $(only(CountryName))
- Mark as New
- Bookmark
- Subscribe
- Mute
- Subscribe to RSS Feed
- Permalink
- Report Inappropriate Content
Could do this with a calculated dimension?
- Mark as New
- Bookmark
- Subscribe
- Mute
- Subscribe to RSS Feed
- Permalink
- Report Inappropriate Content
Sorry, my post was rather premature Brian. (Perhaps I should read the manual more closely). Yes, it is possible to use a calculated dimension, or even a drill down dimension as the field that supplies the link to the shapes.For those configuring this:
If using a drill down, simply configure it to go from ISO country code to ISO state code. Otherwise you can use something like:
=if(Count(DISTINCT Country)>1, CountryCode, StateCode)
The Load SVG path configuration item can then be used to dynamically determine the shape file to be used. I just tested this and it works very nicely. I used the following for the Load SVG Path expression:
=if(Count(DISTINCT Country)>1, 'World.svg', only(Country)&'.svg')
Though a much better way would be to simply add ISO country code into the spreadsheet that Brian has provided with the extension and link the list of countries and file names into your data model. Then you could just use something like:
=if(Count(DISTINCT Country)>1, 'World.svg', only(FileName))
This is excellent Brian!
- Mark as New
- Bookmark
- Subscribe
- Mute
- Subscribe to RSS Feed
- Permalink
- Report Inappropriate Content
When I click and drag the svgMap object onto the layout, it shows
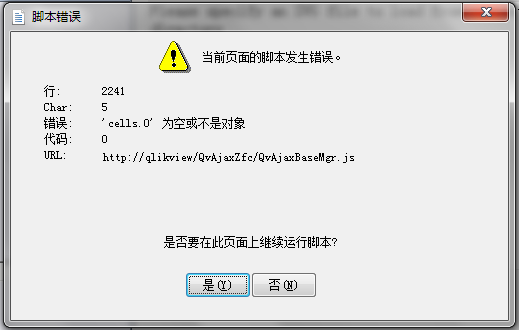
When I choice "China" in Map selection, there is nothing displayed.
I'm using QV10.0 SR4 & Windows7
next...
It is working well when QV is updated to 11.0 SR2.
Another question, why it must runs under WebView mode? Is it possible to run under normal mode?