Unlock a world of possibilities! Login now and discover the exclusive benefits awaiting you.
- Qlik Community
- :
- All Forums
- :
- QlikView Integrations
- :
- New QlikView Mapping Extensions on QlikMarket
- Subscribe to RSS Feed
- Mark Topic as New
- Mark Topic as Read
- Float this Topic for Current User
- Bookmark
- Subscribe
- Mute
- Printer Friendly Page
- Mark as New
- Bookmark
- Subscribe
- Mute
- Subscribe to RSS Feed
- Permalink
- Report Inappropriate Content
New QlikView Mapping Extensions on QlikMarket
EDIT: These extensions are no longer maintained on QlikMarket since that is not an appropriate place for free and unsupported extensions. I've modified the links below to point to the github repositories where I now keep them. Also, since they're now hosted on github, feel free to make contributions to the code.
Hi everyone,
The demand for mapping in QlikView seems to be a hot topic these days, so I’ve put together two extensions that are now available on QlikMarket bearing the QlikView name.
The first one is an extension which uses SVG images to connect to the data and color and shade the regions in that image:
brianwmunz/svgReader-QV11 · GitHub
Similar to this map of US Counties:
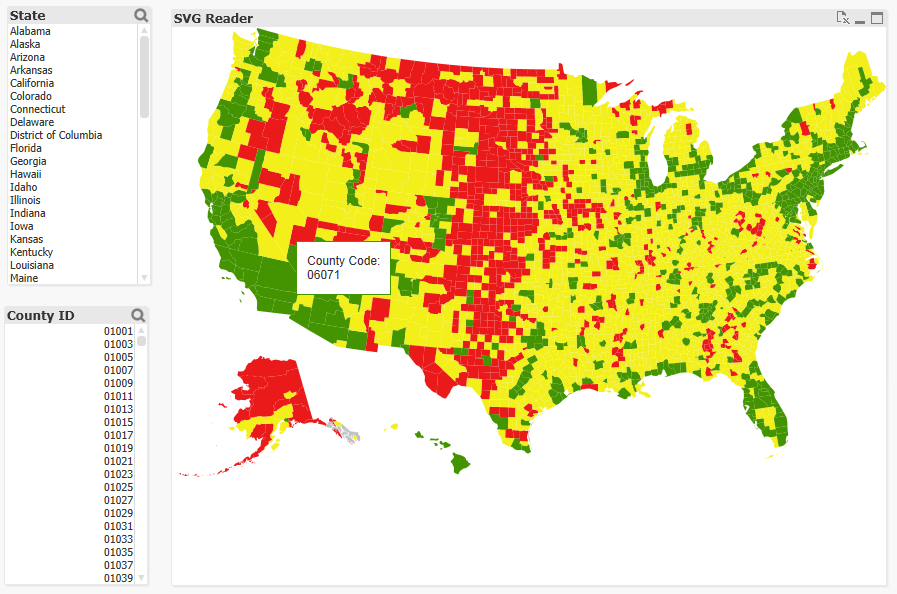
There’s no geospatial connection here (long/lat points can’t be plotted, etc.), but it should prove useful for a lot of simple needs and uses for visualization of a geographical entity. It comes prepackaged with 35 or so maps of countries, etc. and also offers the ability to load in your own custom SVGs for things like floor plans, seating charts, etc.
The second extension is a simple geospatial mapping extension similar to the Google Maps and various other extensions you might have seen in community:
brianwmunz/QuickMap-QV11 · GitHub
This extension simply takes geographic data (longitude/latitude points) from QlikView and draws it over a map. It supports the drawing of dots, lines, or polygon shapes. For example:
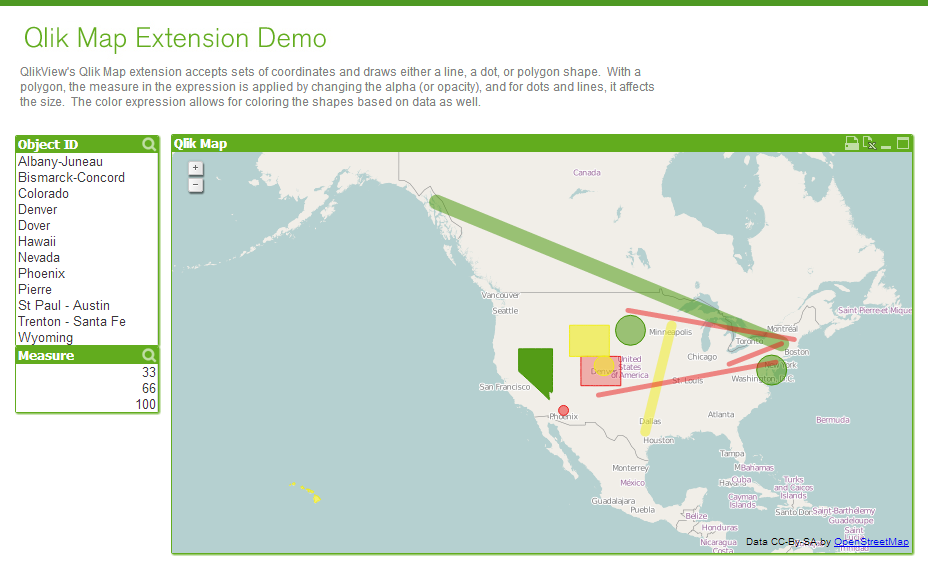
This doesn’t offer near the capabilities of a server based geospatial mapping solution like ESRI, GeoQlik, Idevio, etc. simply because it’s not server side, but it should be helpful for less heavy and complex mapping needs.
Anyway, I hear a lot about need for mapping so I thought I’d let everyone know.
- Mark as New
- Bookmark
- Subscribe
- Mute
- Subscribe to RSS Feed
- Permalink
- Report Inappropriate Content
Any ideas of how to get this to work I am pretty excited to include it in a new tool that I am building for my team.
- Mark as New
- Bookmark
- Subscribe
- Mute
- Subscribe to RSS Feed
- Permalink
- Report Inappropriate Content
Any ideas of how to get this to work I am pretty excited to include it in a new tool that I am building for my team.
- Mark as New
- Bookmark
- Subscribe
- Mute
- Subscribe to RSS Feed
- Permalink
- Report Inappropriate Content
Try it now, Aadil, the updated extension should be posted.
- Mark as New
- Bookmark
- Subscribe
- Mute
- Subscribe to RSS Feed
- Permalink
- Report Inappropriate Content
Hi Brian,
your Extensions are great.
BUT 
The Qlik Map Extension crashes my qlikview (10 SR6 and IE9), if i add in a new document.
For the svg map i get an error
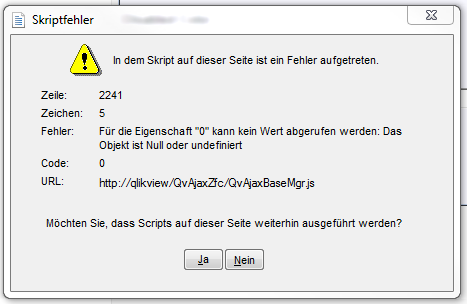
can you fix this?
Thanks Lars
- Mark as New
- Bookmark
- Subscribe
- Mute
- Subscribe to RSS Feed
- Permalink
- Report Inappropriate Content
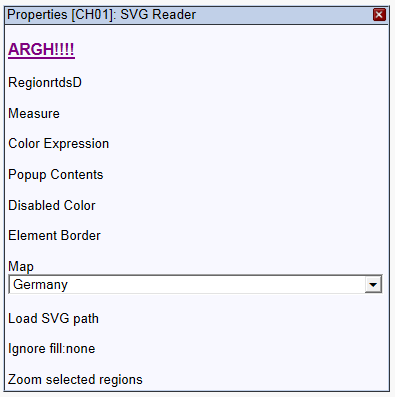
Hoo boy. It looks like I left in some old stuff. I'll fix and get the market version updated, then let you know.
Thanks.
- Mark as New
- Bookmark
- Subscribe
- Mute
- Subscribe to RSS Feed
- Permalink
- Report Inappropriate Content
Brian, I've been trying to hook these in with some UK SVG's I've found, one for London Boroughs and one for UK Counties - but no luck, the SVG's don't have pretty names that fit into the London Boroughs or Counties but just have 'G12' or path122 .. I don't really understand the structures, so don't know if it is me being stupid or them being overcomplicated! I must admit, I've only just worked out how to work with KML files!
I've enclosed two SVG's I've got and an app's that they should be able to work with .. don't know if anyone fancies having a look at this for me .. I'm stumped at the moment!
Hmm .. not just need to work out how to attach ..
Ok, so done so .. I reckon if I can figure out the London boroughs I can do the regions / counties later ..
- Mark as New
- Bookmark
- Subscribe
- Mute
- Subscribe to RSS Feed
- Permalink
- Report Inappropriate Content
With the SVGs the regions in them need to have some sort of proper ID. Otherwise, there's no way to know what those regions are and link them to your data. So, if I have an SVG with the state of Pennsylvania and my dimension has PA, the svg's ID for Pennsylvania needs to be PA.
You can email me these apps/svgs if you want.
Thanks.
- Mark as New
- Bookmark
- Subscribe
- Mute
- Subscribe to RSS Feed
- Permalink
- Report Inappropriate Content
I got a new computer and am finally able to use this new map extension. I am attempting to input a map that simply shows which states are selected.
Whenever I put in a color expression it doesnt show up and I have set a dsiabled color as well and while it changes the data to the state I clikced on it doesnt change color to indicate that it has been selected. Any ideas?
- Mark as New
- Bookmark
- Subscribe
- Mute
- Subscribe to RSS Feed
- Permalink
- Report Inappropriate Content
Hi,
Are you using the two character abbreviation of the states and passing it into the extension?
- Mark as New
- Bookmark
- Subscribe
- Mute
- Subscribe to RSS Feed
- Permalink
- Report Inappropriate Content
Hi Brian,
Is the market version the most up-to-date as I'm having the same problem as lzimmermann above has had? For info. I'm on v10 SR3.
Thanks,
Ralph