Unlock a world of possibilities! Login now and discover the exclusive benefits awaiting you.
- Qlik Community
- :
- All Forums
- :
- QlikView Integrations
- :
- SVG Maps
- Subscribe to RSS Feed
- Mark Topic as New
- Mark Topic as Read
- Float this Topic for Current User
- Bookmark
- Subscribe
- Mute
- Printer Friendly Page
- Mark as New
- Bookmark
- Subscribe
- Mute
- Subscribe to RSS Feed
- Permalink
- Report Inappropriate Content
SVG Maps
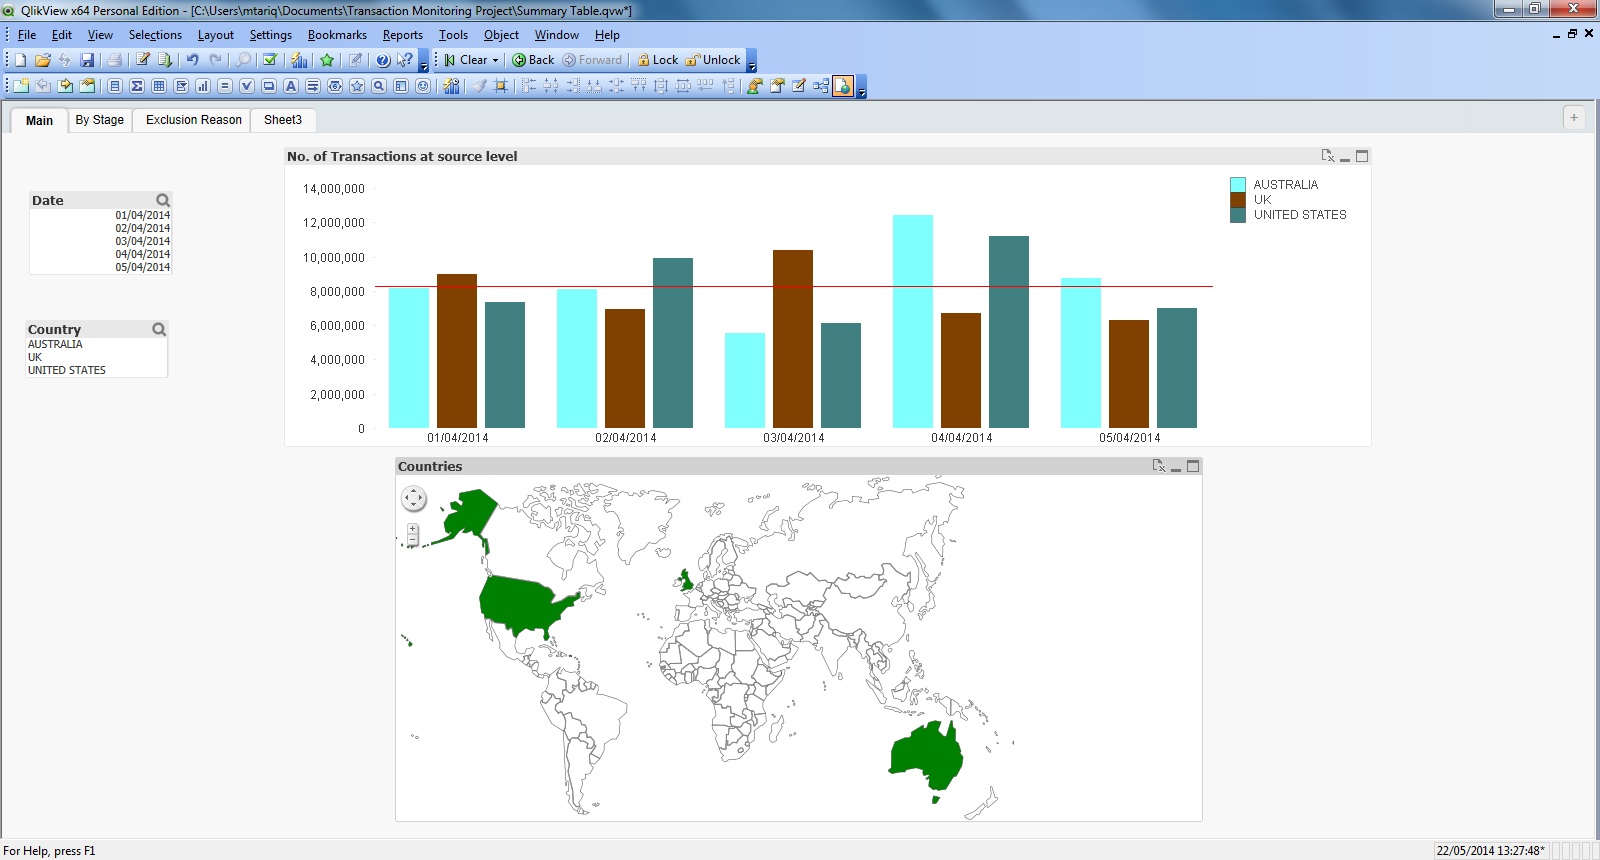
Hi,
I have been trying to change the colour of countries according to a condition in the svg maps extension. I am actually trying to define 3 colours in the colour expression Green ( when no. is greater than 1 standard deviation from the mean), Amber (when no. is greater than 2 standard deviation from the mean) and red (when no. is greater than 3 standard deviation from the mean).
I have used this simple formula to start with but it just picks up the false value in the IF statement. have a look below:-
IF([NO. OF SOURCE TRANSACTIONS] > Avg ([NO. OF SOURCE TRANSACTIONS]), Red(),Green())
Can someone helps please?
Regards,
Mohammad.
- Mark as New
- Bookmark
- Subscribe
- Mute
- Subscribe to RSS Feed
- Permalink
- Report Inappropriate Content
Maybe the [NO. OF SOURCE TRANSACTIONS] field is at a more detailed level than the Country level, so you should use an aggregation function in the IF condition like SUM in order to compare the total transactions of a country vs the AVG transactions.
What do you want to accomplish? For each Country calculate:
A. Total transactions of the Country vs the average transactions/Country
B. Avg transactions of the Country vs the avg transactions globally
- Mark as New
- Bookmark
- Subscribe
- Mute
- Subscribe to RSS Feed
- Permalink
- Report Inappropriate Content
Hi,
Adding the aggr function makes everything blank in the map. Basically I want to change the colour of the countries based on the no, of source transactions to show if they are average, 1 std above, 2 std above or 3 std above average on particular days for that particular country. Please let me know whats's the best way to do it.
I have tried the below formula but the colour changes to only red from green not blue, is there anything wrong with my If statements?
=IF(sum([NO. OF SOURCE TRANSACTIONS]) > Avg(AGGR(Sum([NO. OF SOURCE TRANSACTIONS]),Date,Country)) and (sum([NO. OF SOURCE TRANSACTIONS]) < (Avg(AGGR(Sum([NO. OF SOURCE TRANSACTIONS]),Date,Country))))+ (stdev(AGGR(Sum([NO. OF SOURCE TRANSACTIONS]),Date,Country))), green(),
IF(sum([NO. OF SOURCE TRANSACTIONS]) > (Avg(AGGR(Sum([NO. OF SOURCE TRANSACTIONS]),Date,Country)))+ stdev(AGGR(Sum([NO. OF SOURCE TRANSACTIONS]),Date,Country)), blue(),
red()
)
)
- Mark as New
- Bookmark
- Subscribe
- Mute
- Subscribe to RSS Feed
- Permalink
- Report Inappropriate Content
Hey Mohammad,
There is no such feature built into the extension. Currently it will take the color expression and then scale the fill opacity based on your min and max values on the expression.
- Mark as New
- Bookmark
- Subscribe
- Mute
- Subscribe to RSS Feed
- Permalink
- Report Inappropriate Content
Hi Alexander
How come? This expression telling the SVG what colour to used based on the data, using Qlikview calculations.
Is the issue the expression is wrong, or the Plugin cannot cope with displaying multiple colours?
- Mark as New
- Bookmark
- Subscribe
- Mute
- Subscribe to RSS Feed
- Permalink
- Report Inappropriate Content
Your expressions is correct but the extension don't function that way, currently it supports a linear scale that's defined by supplying the 'max' color value and then the opacity is scaled between the min/max value of your data.
The extension is open sourced and available here https://github.com/brianwmunz/svgReader-QV11 so if you feel it miss some functionality I recommend that you send a pull request and add that functionality.
- Mark as New
- Bookmark
- Subscribe
- Mute
- Subscribe to RSS Feed
- Permalink
- Report Inappropriate Content
Hi Alexander
Mohammed and I have been pondering on this, thanks for clearing it up. I must have missed that description on the plugin. Cheers, I'll think of another way to display this.
- Mark as New
- Bookmark
- Subscribe
- Mute
- Subscribe to RSS Feed
- Permalink
- Report Inappropriate Content
i have used it slightly differently to color the map based on conditions...similar to what the requirement in the op seems to be.
i use the following:
for measure, =1
color expression, if(/*expression*/ < /*mean*/, green(), if(/*expression*/>/*mean*/ , red(), yellow()))
any colors can be used using rgb or argb functions instead of standard colors.
this way, the map is colored the way i want them to be based on conditions.
if you want colors (shades) within the 3 colors...different shades within the hard coded colors (based on min/max within the three ranges), then change measure to the expression.
of course, instead of mean, you can use any comparison...i have used fractiles to color based on 25th, and 75th percentiles or mean, or hard coded numbers etc. based on the requirement.
- Mark as New
- Bookmark
- Subscribe
- Mute
- Subscribe to RSS Feed
- Permalink
- Report Inappropriate Content
Thanks.. I'll try this