Unlock a world of possibilities! Login now and discover the exclusive benefits awaiting you.
- Qlik Community
- :
- All Forums
- :
- QlikView Integrations
- :
- Re: Values on data points - how to have fewer valu...
- Subscribe to RSS Feed
- Mark Topic as New
- Mark Topic as Read
- Float this Topic for Current User
- Bookmark
- Subscribe
- Mute
- Printer Friendly Page
- Mark as New
- Bookmark
- Subscribe
- Mute
- Subscribe to RSS Feed
- Permalink
- Report Inappropriate Content
Values on data points - how to have fewer values on data points
Hi, QV
I have one problem that I don't know he solution.
I am seeing if you can figure it out.
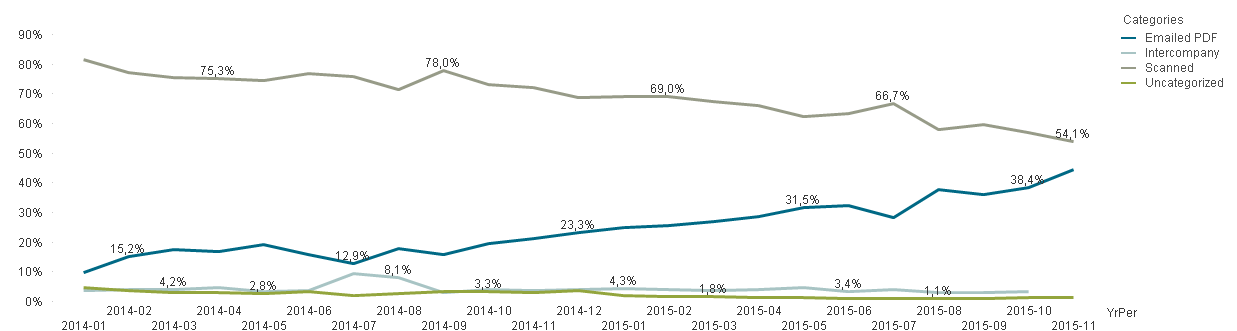
I have a line chart with a lot of values.
I want to see our progress in many periods.
I want to have value on data points.
But my problem is that when I select values on data points in the expression I get all the data points.
I only want couple of my data points have value.
How can I control which data points I can show in the chart.
E.g. only show the first and the last data point.
Any ideas?
regards Darri
- « Previous Replies
-
- 1
- 2
- Next Replies »
Accepted Solutions
- Mark as New
- Bookmark
- Subscribe
- Mute
- Subscribe to RSS Feed
- Permalink
- Report Inappropriate Content
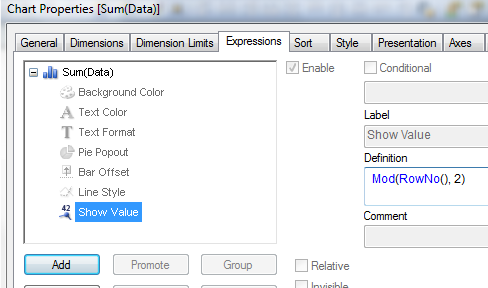
Sample is attached. Used 'Show Value' expression Mod(RowNo(), 2) to show the alternative data points.
- Mark as New
- Bookmark
- Subscribe
- Mute
- Subscribe to RSS Feed
- Permalink
- Report Inappropriate Content
I doubt, whether this restriction is possible
- Mark as New
- Bookmark
- Subscribe
- Mute
- Subscribe to RSS Feed
- Permalink
- Report Inappropriate Content
Add a second expression sourced from the first, but that only establishes itself for the dates you want. For example:
Sales = sum(Sales)
DisplaySales = if(Date=max(total Date),TotalSales)
Only display data values on the second expression. Maybe I'm missing an easier way, though, as I don't see the "Show Value" on a line chart. Maybe I'm just missing something, You might be able to refer to max(total Date) in that field, or max(Date).
- Mark as New
- Bookmark
- Subscribe
- Mute
- Subscribe to RSS Feed
- Permalink
- Report Inappropriate Content
Go through this thread:
- Mark as New
- Bookmark
- Subscribe
- Mute
- Subscribe to RSS Feed
- Permalink
- Report Inappropriate Content
One more workaround like:
- Mark as New
- Bookmark
- Subscribe
- Mute
- Subscribe to RSS Feed
- Permalink
- Report Inappropriate Content
Sample is attached. Used 'Show Value' expression Mod(RowNo(), 2) to show the alternative data points.
- Mark as New
- Bookmark
- Subscribe
- Mute
- Subscribe to RSS Feed
- Permalink
- Report Inappropriate Content
Hi, tresesco
thanks for respond.
This is what I was looking for.
How can I use this for many lines.
This formula works for one line but not when I have many lines
- Mark as New
- Bookmark
- Subscribe
- Mute
- Subscribe to RSS Feed
- Permalink
- Report Inappropriate Content
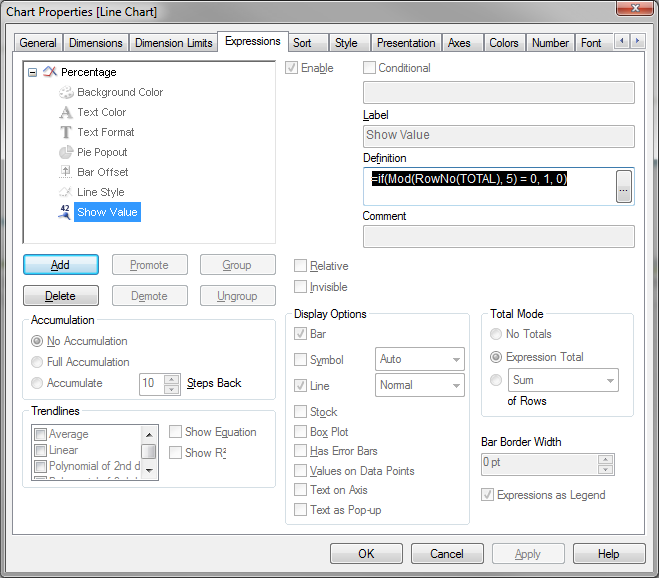
If you click the + sign next to the expression on Properties | Expressions, you will see an option called show value. This can contain a conditional function to turn the display on or off at specific points.
First uncheck "Values on Data Points"
Then add an expression to "Show Value", for example: =if(Mod(RowNo(TOTAL), 5) = 0, 1, 0)
- Mark as New
- Bookmark
- Subscribe
- Mute
- Subscribe to RSS Feed
- Permalink
- Report Inappropriate Content
It's not about single line-multi lines. It's about getting the calculation right. In your app, rowno() is not flat as it has multiple dimensions. Using Total, you could handle that. However, here is another way. try expression like: Mod(right(YrPer,2),2)
- Mark as New
- Bookmark
- Subscribe
- Mute
- Subscribe to RSS Feed
- Permalink
- Report Inappropriate Content
I had a similar requirement today and I was able to make it work with Dual function. You need to create new expressions for the data points you want to show. If you want to show data points of E2 expression on E1 expression line then After E1 expression create E2 with value Dual(E2, E1) and check Invisible and Line and 'values on data points). This will show E2 values as data points on E1. This will work with many expressions also.
- « Previous Replies
-
- 1
- 2
- Next Replies »