Unlock a world of possibilities! Login now and discover the exclusive benefits awaiting you.
- Qlik Community
- :
- All Forums
- :
- QlikView Integrations
- :
- Re: Google Maps - Cluster
- Subscribe to RSS Feed
- Mark Topic as New
- Mark Topic as Read
- Float this Topic for Current User
- Bookmark
- Subscribe
- Mute
- Printer Friendly Page
- Mark as New
- Bookmark
- Subscribe
- Mute
- Subscribe to RSS Feed
- Permalink
- Report Inappropriate Content
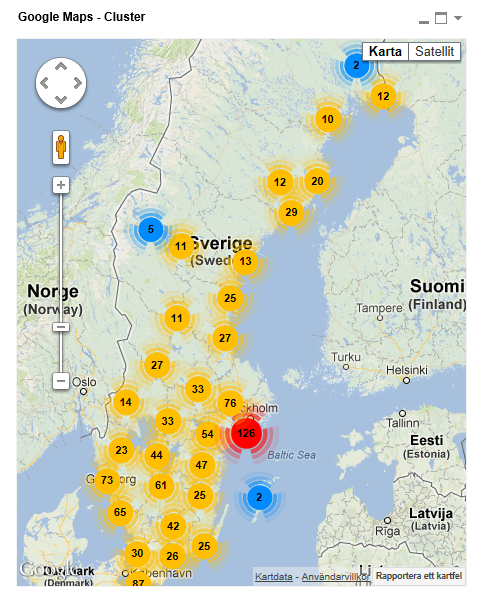
Google Maps - Cluster
Google Maps Extension with Cluster support.
QlikTech takes no responsibility for any code and QlikTech Support Agreement does not cover issues with this extension.
Please review Googles license agreement before you put this into production.
Introduction
This is a QlikView extension object that integrates Google Maps Javascript API V3 and a third party library called MarkerClusterPlus into QlikView.
Load a set a coordinates into QlikView and visualize them together with this extension. The clustering feature is create when you have alot of data points and needs to group/cluster them together for greater visability and performance.
The maxzoom property defines at what zoom level you want your markers clustered. The grid size property controls how big or small cluster grid size you want.
You can either use the extension 'as is' or use it as a base to further customize it to fit your needs.
Download the extension and view source code at: https://github.com/mindspank/GoogleMaps-Cluster-QV11
If you build something awesome please share it with the community!
Live long and prosper.
2015-02-15
Removed download from post, please grab the latest version from Github instead.
2014-02-03
Various fixes.
2014-01-09
There has been numerous upgrades to the extension.
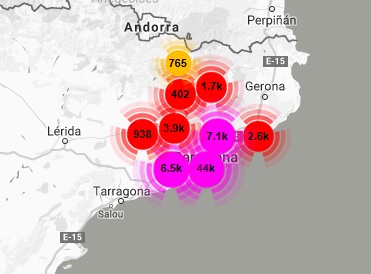
Now clusters now display the value of your expression and with added support to include more information in pop-up labels.
Example grayscale styled map included.
Possibility to show only a single cluster icon style if you do not want it to scale according to the number of markers in the cluster.
2013-06-17
Added custom marker support. Now you can specify a url for an custom marker. Accepts all major image file types.
- Mark as New
- Bookmark
- Subscribe
- Mute
- Subscribe to RSS Feed
- Permalink
- Report Inappropriate Content
Hi Shahbaz & Alex,
Thanks for your help, the extension work for me now both on the desktop and server.
- Mark as New
- Bookmark
- Subscribe
- Mute
- Subscribe to RSS Feed
- Permalink
- Report Inappropriate Content
Hi Narendiran,
Good to know and can you share how did you troubleshoot it? So that others facing same issue can resolve it.
Thanks.
- Mark as New
- Bookmark
- Subscribe
- Mute
- Subscribe to RSS Feed
- Permalink
- Report Inappropriate Content
'NaN' usually comes when you giving wrong measure. For Clusters you should check 'Single Cluster Style' in properties. If you have it checked and still not showing clusters then the Cluster Image is missing in the Google cluster folder path.
You can add a image destination in Script.js.
I suggest download the updated extension which I've posted above and try with it. It's on Page 21 of this post.
FYI, it is same extension from Alexander but I added 3 more cluster colors for my own convenience & removed click on zoom for markers.
Thanks.
- Mark as New
- Bookmark
- Subscribe
- Mute
- Subscribe to RSS Feed
- Permalink
- Report Inappropriate Content
Hi, is there an easy way to incorporate a transparent (.png) overlay on to a map using this extension? I am needing to have the map show different colored areas representing the boundaries of our rural employment regions. I am not able to find an svg representing this area but only a shapefile (shp) or the transparent image mentioned above. I am making the assumption overlaying the.png would be the easiest option but I am certainly open to hearing other ideas.
Oh, and the second part of this question is, can I do this without impacting the other maps that use this extension? I played around with the included .js file a bit but I'll be the first to admit that javascript isn't my strongest suit. I was thinking if I had to adjust the .js to make this happen, I would just copy and rename the extension to suit my purpose. Or are there better ideas there?
At any rate, if anyone could help I would be greatly appreciative! Cheers!
- Mark as New
- Bookmark
- Subscribe
- Mute
- Subscribe to RSS Feed
- Permalink
- Report Inappropriate Content
Hello,
I have a question:
Do you know if It's possible to change the image?
I want to create differente clusters which depend on a dimension : If (MyDimension = 'A', then icon1,
if((MyDimension = 'B', then icon2....)
Thanks!
- Mark as New
- Bookmark
- Subscribe
- Mute
- Subscribe to RSS Feed
- Permalink
- Report Inappropriate Content
Hello,
First of all - big thanks to Alexander for this amazing extension - it was exactly what I was searching for. Almost implemented it , just the final step left - running it on server.
Is it possible to load two separate data sets on one map - lets's say stores A and stores B and have them displayed by separate markers and clustered into separate clusters?? Has anyone achieved it?
Thanks!
- Mark as New
- Bookmark
- Subscribe
- Mute
- Subscribe to RSS Feed
- Permalink
- Report Inappropriate Content
Hi everyone!
I have a trouble with the extension:
when i zoomed in a cluster of customers the position of the customers are not the correct. It changes to show an aligned result:
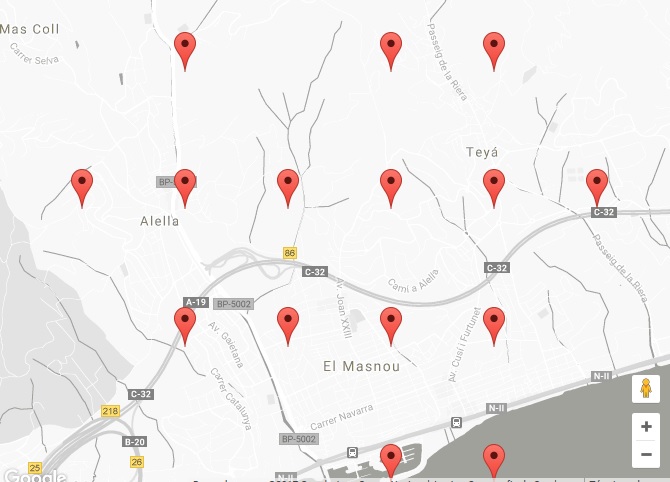
If i select an individual customer the position is correct
Do you know how i can solve it??
Thanks!
- Mark as New
- Bookmark
- Subscribe
- Mute
- Subscribe to RSS Feed
- Permalink
- Report Inappropriate Content
Maybe because the Latitude & Longitude you've provided doesn't match on Region level but only City level.
I'm assuming the above image is Region/State name and below is District or city or county name?
So check the Latitude & Longitude for the above image and it will point you to correct location.
There cannot be no any other reasons for the data points to not match the map except latitude & longitude.
- Mark as New
- Bookmark
- Subscribe
- Mute
- Subscribe to RSS Feed
- Permalink
- Report Inappropriate Content
Hey,
Have you solved your issue? I faced a similar one, then I checked my latitude and longitude format - they have to be separated not by comma, but by dot. I used:
replace replace(longitude,',','.') as longitude1,
- Mark as New
- Bookmark
- Subscribe
- Mute
- Subscribe to RSS Feed
- Permalink
- Report Inappropriate Content
Hi Andrius, which issue are you referring to... the error shown below?