Unlock a world of possibilities! Login now and discover the exclusive benefits awaiting you.
- Qlik Community
- :
- All Forums
- :
- QlikView Integrations
- :
- Re: New QlikView Mapping Extensions on QlikMarket
- Subscribe to RSS Feed
- Mark Topic as New
- Mark Topic as Read
- Float this Topic for Current User
- Bookmark
- Subscribe
- Mute
- Printer Friendly Page
- Mark as New
- Bookmark
- Subscribe
- Mute
- Subscribe to RSS Feed
- Permalink
- Report Inappropriate Content
New QlikView Mapping Extensions on QlikMarket
EDIT: These extensions are no longer maintained on QlikMarket since that is not an appropriate place for free and unsupported extensions. I've modified the links below to point to the github repositories where I now keep them. Also, since they're now hosted on github, feel free to make contributions to the code.
Hi everyone,
The demand for mapping in QlikView seems to be a hot topic these days, so I’ve put together two extensions that are now available on QlikMarket bearing the QlikView name.
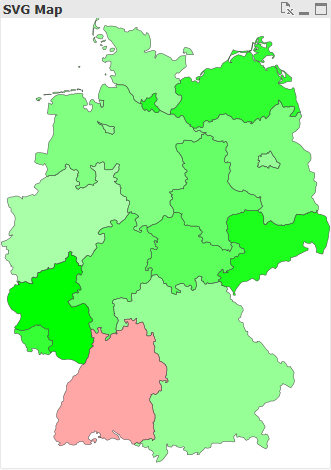
The first one is an extension which uses SVG images to connect to the data and color and shade the regions in that image:
brianwmunz/svgReader-QV11 · GitHub
Similar to this map of US Counties:
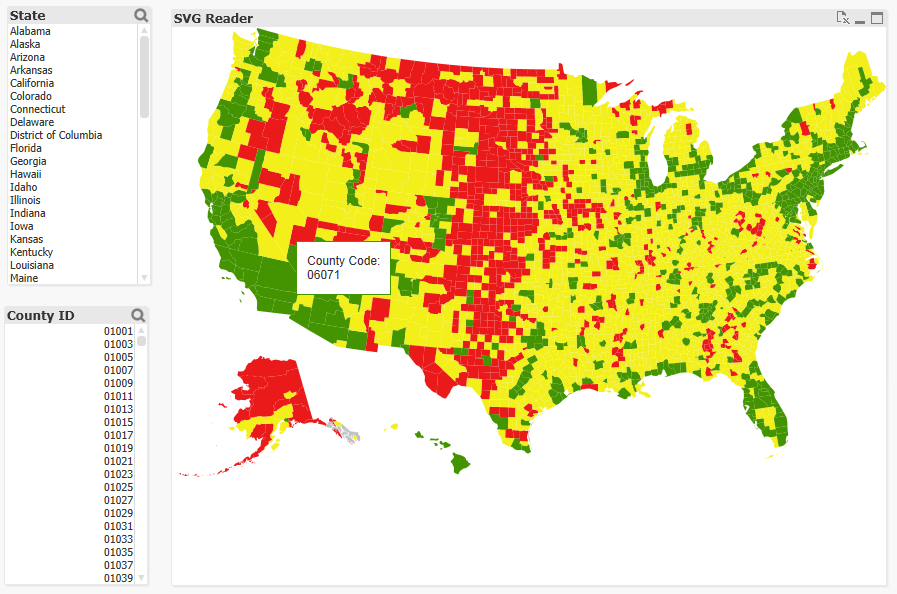
There’s no geospatial connection here (long/lat points can’t be plotted, etc.), but it should prove useful for a lot of simple needs and uses for visualization of a geographical entity. It comes prepackaged with 35 or so maps of countries, etc. and also offers the ability to load in your own custom SVGs for things like floor plans, seating charts, etc.
The second extension is a simple geospatial mapping extension similar to the Google Maps and various other extensions you might have seen in community:
brianwmunz/QuickMap-QV11 · GitHub
This extension simply takes geographic data (longitude/latitude points) from QlikView and draws it over a map. It supports the drawing of dots, lines, or polygon shapes. For example:
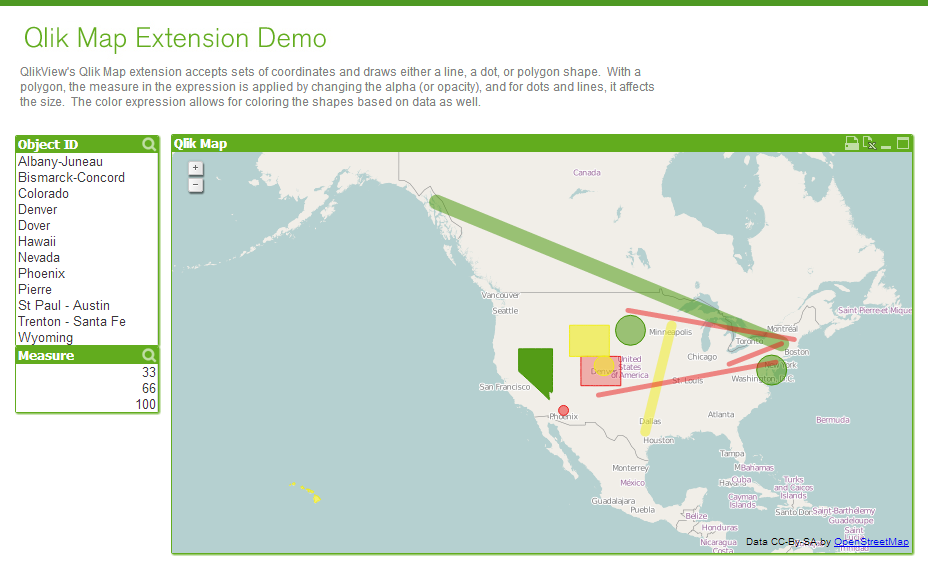
This doesn’t offer near the capabilities of a server based geospatial mapping solution like ESRI, GeoQlik, Idevio, etc. simply because it’s not server side, but it should be helpful for less heavy and complex mapping needs.
Anyway, I hear a lot about need for mapping so I thought I’d let everyone know.
- Mark as New
- Bookmark
- Subscribe
- Mute
- Subscribe to RSS Feed
- Permalink
- Report Inappropriate Content
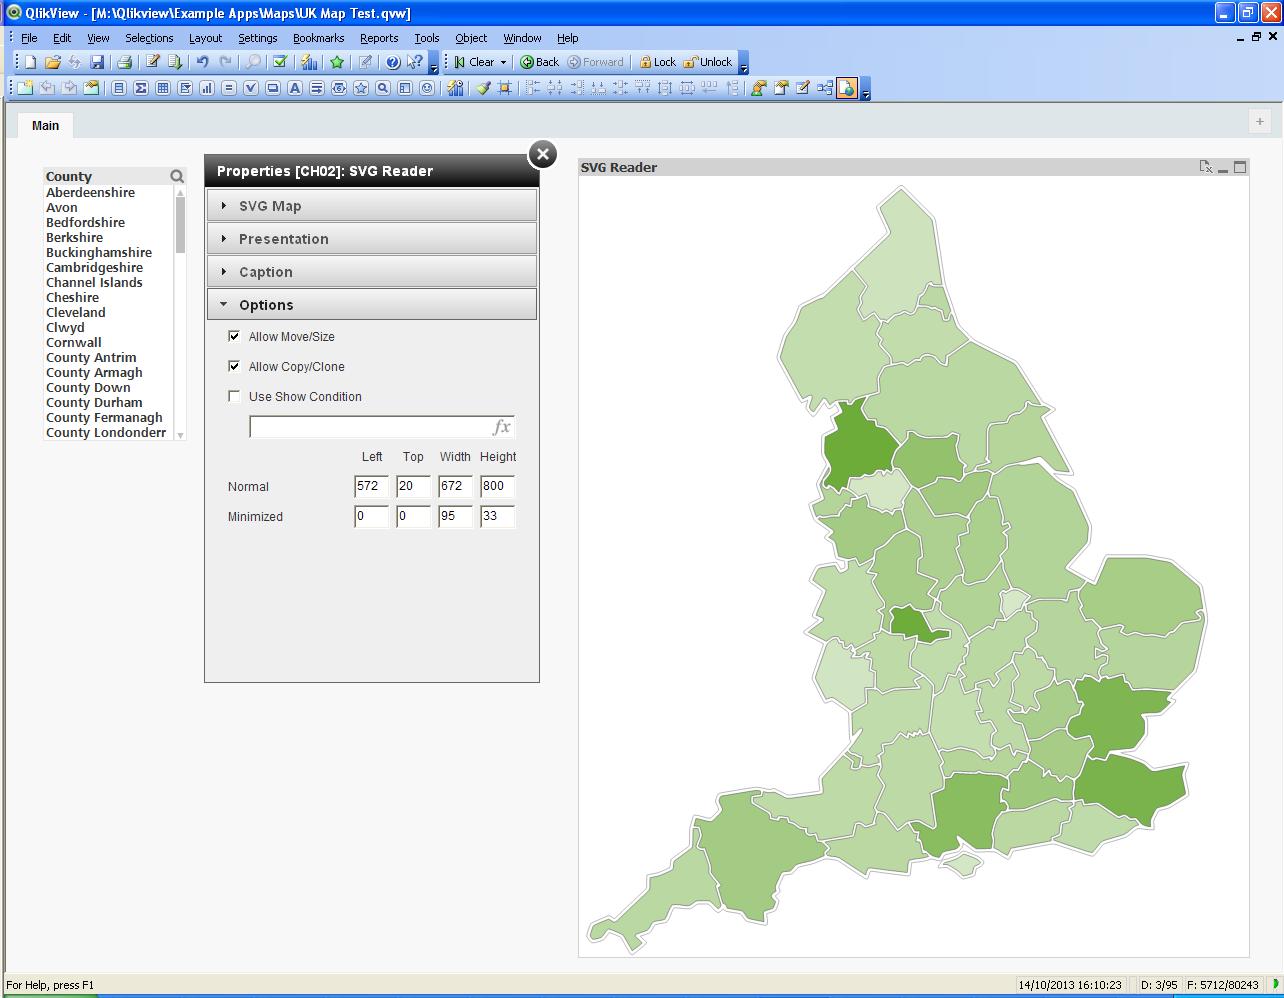
Getting closer! How do I get Scotland & Wales into this map?
- Mark as New
- Bookmark
- Subscribe
- Mute
- Subscribe to RSS Feed
- Permalink
- Report Inappropriate Content
Unfortunately, I was only able to find an SVG of England .. you can only put Scotland in if you find an SVG that has it .. Sorry! I am on the look out, so if I ever find one, will let you know!
- Mark as New
- Bookmark
- Subscribe
- Mute
- Subscribe to RSS Feed
- Permalink
- Report Inappropriate Content
No worries, thanks Julie. I did try and add Scotland from the regions svg, but it badly overlapped the top of England.
im going to attempt to fix this tomorrow or just settle for the regions map tomorrow. Will post back on here if I have any luck.
michael.
- Mark as New
- Bookmark
- Subscribe
- Mute
- Subscribe to RSS Feed
- Permalink
- Report Inappropriate Content
Hi,
Just an update. I managed to get the UK regions.svg file working ok, but did't get anywhere with obtain a complete counties svg file.
Hoping this will be resolved properly in Qlikview.next Ideally I would want to pass in a postcode and have much greater drill down capabilities.
- Mark as New
- Bookmark
- Subscribe
- Mute
- Subscribe to RSS Feed
- Permalink
- Report Inappropriate Content
Hi Brian,
I have downloaded the SVG Map.
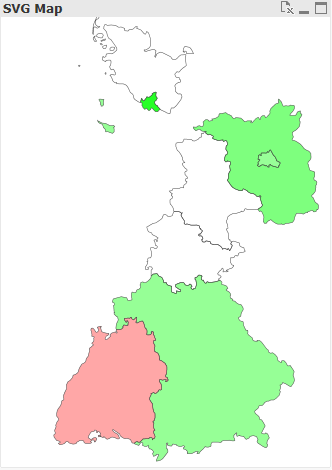
I am facing some issues in Europe & UK Conuntries.
Please find the below error:

I am using QlikView 11 sr2 and IE 8.
Anything I have missed?
Regards
Sathish
- Mark as New
- Bookmark
- Subscribe
- Mute
- Subscribe to RSS Feed
- Permalink
- Report Inappropriate Content
You’re using one of the built in maps or your own custom SVG?
I would check your data by building a straight table that contains the same properties as the extension. It appears as if the javascript is having a hard time dealing with the amount of data.
- Mark as New
- Bookmark
- Subscribe
- Mute
- Subscribe to RSS Feed
- Permalink
- Report Inappropriate Content
Hi Brian,
I want to use a heatmap for US at DMA(Designated Market Area) level. What are the changes i need to make in the existing extension? Do i need to just download a svg image of the US-DMA level map and place it in the extension folder with other maps and then use it directly in the application or something else?
- Mark as New
- Bookmark
- Subscribe
- Mute
- Subscribe to RSS Feed
- Permalink
- Report Inappropriate Content
Hi Brian,
thanks for this great extensions.
I guess our .qvw is a bit special, because I did not find any post describing the same "problem" I'm experiencing:
I attached a little example. The demo-eata get's displayed correctly, but we don't use the tabrow in our application, it's hidden. That's why we use actions, to switch sheets. (I think it's not a Problem with your extension, but QlikView itself. Unfortunately getting rid of the QlikView bug might be a bit of more work, then adjusting the extension)
 )
)- Mark as New
- Bookmark
- Subscribe
- Mute
- Subscribe to RSS Feed
- Permalink
- Report Inappropriate Content
Brian, look into using Modernizr: the feature detection library for HTML5/CSS3 for checking SVG support. The library is very tiny and instead of checking user agents, it actually attempts to create a SVG object. If it fails, it will return an error which you can then add logic around to fall back to html instead.
- Mark as New
- Bookmark
- Subscribe
- Mute
- Subscribe to RSS Feed
- Permalink
- Report Inappropriate Content
Thanks. Yeah, when I get some time I plan on using modernizr to detect SVG support, and if the user supports it, simply embed the SVG on the page. If the browser does not support it, it will fall back on the current version of the svg extension which draws out the image using Raphael.