Unlock a world of possibilities! Login now and discover the exclusive benefits awaiting you.
- Qlik Community
- :
- All Forums
- :
- QlikView App Dev
- :
- A problem with a pivot
- Subscribe to RSS Feed
- Mark Topic as New
- Mark Topic as Read
- Float this Topic for Current User
- Bookmark
- Subscribe
- Mute
- Printer Friendly Page
- Mark as New
- Bookmark
- Subscribe
- Mute
- Subscribe to RSS Feed
- Permalink
- Report Inappropriate Content
A problem with a pivot
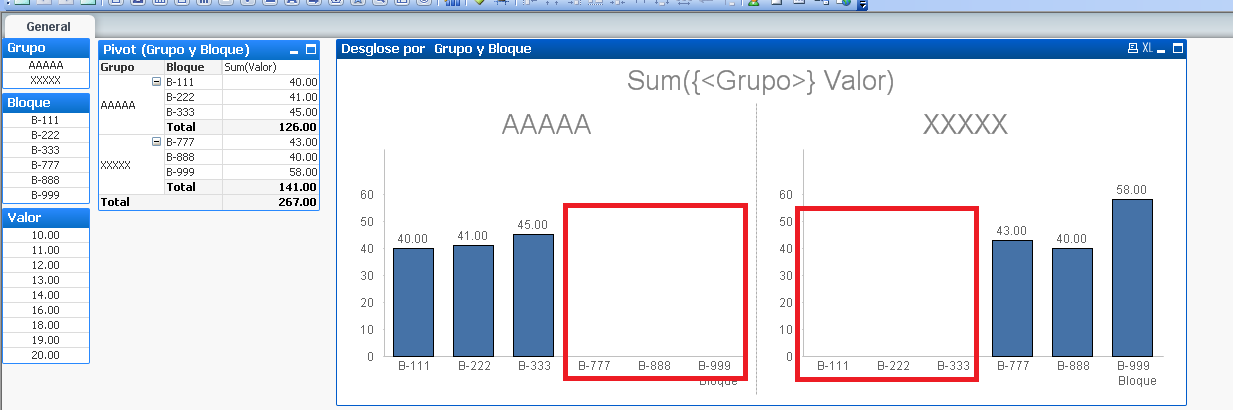
I have a bar chart with two dimensions and an expression,
I want to present the data (Graphic) in two groups according to the possible values of the variable "Grupo" as seen in the figure, but in each of the groups if there are 3 blocks have values and 3 others have no value because are of other group. See pivot table (no graphic)
As I can do to make each group values appear only if the blocks have value?
The areas marked in red on the chart, I want to disappear.
Thanks for your help
Accepted Solutions
- Mark as New
- Bookmark
- Subscribe
- Mute
- Subscribe to RSS Feed
- Permalink
- Report Inappropriate Content
What you want is not possible afaik. See attached qvw for two alternatives.
talk is cheap, supply exceeds demand
- Mark as New
- Bookmark
- Subscribe
- Mute
- Subscribe to RSS Feed
- Permalink
- Report Inappropriate Content
any ideas?
- Mark as New
- Bookmark
- Subscribe
- Mute
- Subscribe to RSS Feed
- Permalink
- Report Inappropriate Content
That cannot be done using two dimensions. You can either create two charts or use only the Bloque dimension. You can use an expression to give the bars of the different groups different colors. See attached qvw.
talk is cheap, supply exceeds demand
- Mark as New
- Bookmark
- Subscribe
- Mute
- Subscribe to RSS Feed
- Permalink
- Report Inappropriate Content
ok, correct, but how can I put text values groups automated
In my example AAAAA and XXXXX into the graphic (non estatic) Is Possible?
- Mark as New
- Bookmark
- Subscribe
- Mute
- Subscribe to RSS Feed
- Permalink
- Report Inappropriate Content
What makes you think the AAAAA and XXXXX are static?
talk is cheap, supply exceeds demand
- Mark as New
- Bookmark
- Subscribe
- Mute
- Subscribe to RSS Feed
- Permalink
- Report Inappropriate Content
Non, are the value for Grupo (Variable)
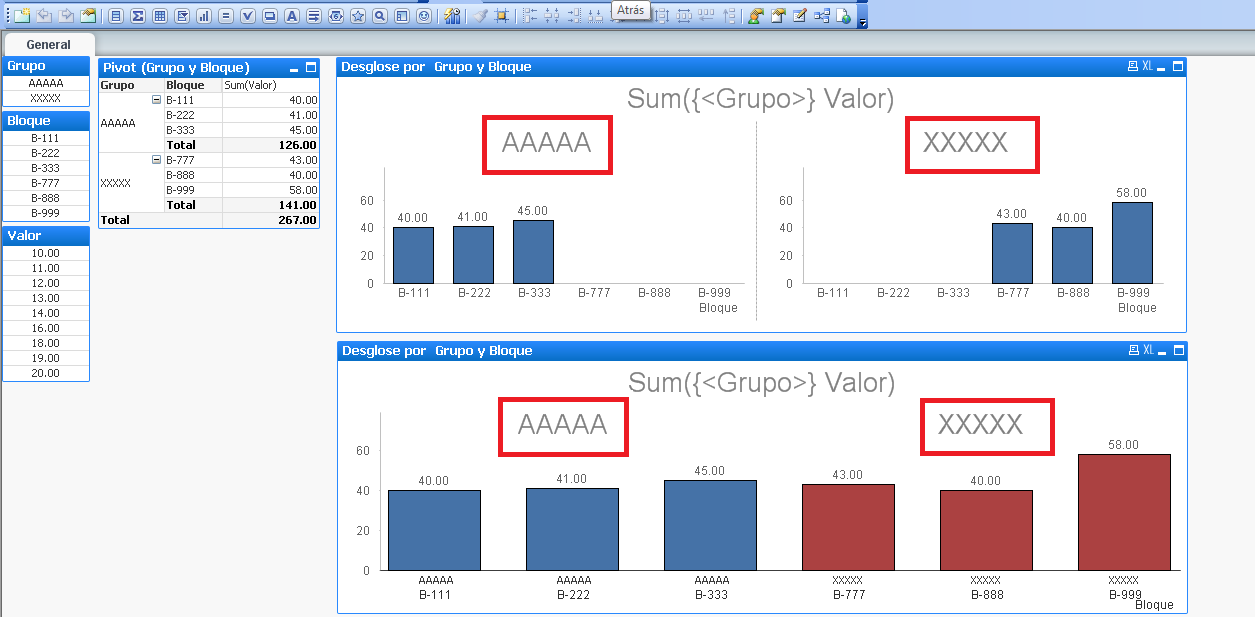
I need the text in the graphic, but if I put them in a table of text or similar are statics
- Mark as New
- Bookmark
- Subscribe
- Mute
- Subscribe to RSS Feed
- Permalink
- Report Inappropriate Content
What you want is not possible afaik. See attached qvw for two alternatives.
talk is cheap, supply exceeds demand
- Mark as New
- Bookmark
- Subscribe
- Mute
- Subscribe to RSS Feed
- Permalink
- Report Inappropriate Content
Many Thank's
Muchas Gracias.
Saludos,
Enrique Colomer
- Mark as New
- Bookmark
- Subscribe
- Mute
- Subscribe to RSS Feed
- Permalink
- Report Inappropriate Content
Finally I've done is create a container with a chart for each value of the Group and has remained as I wanted.
Thanks again for your help.