Unlock a world of possibilities! Login now and discover the exclusive benefits awaiting you.
- Qlik Community
- :
- All Forums
- :
- QlikView App Dev
- :
- Add the average line to a line chart with multiple...
- Subscribe to RSS Feed
- Mark Topic as New
- Mark Topic as Read
- Float this Topic for Current User
- Bookmark
- Subscribe
- Mute
- Printer Friendly Page
- Mark as New
- Bookmark
- Subscribe
- Mute
- Subscribe to RSS Feed
- Permalink
- Report Inappropriate Content
Add the average line to a line chart with multiple lines
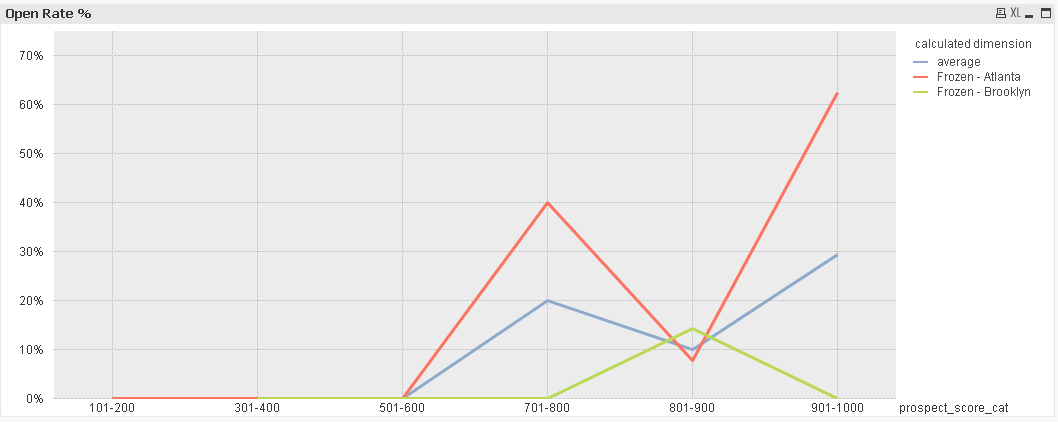
Hi - I'm trying to add an average line to my chart (attached). I would like the average to be based on each of the score categories (000-100, 101-200, etc.). For example, the average displayed for 000-100 should be the average of 19.2% and 18.4%, and the average displayed for 901-1000 should be the average of 15.9% and 15.2%. I've spent quite a while on the forum and haven't been able to find a solution to this. Any insight is greatly appreciated!
- « Previous Replies
-
- 1
- 2
- Next Replies »
Accepted Solutions
- Mark as New
- Bookmark
- Subscribe
- Mute
- Subscribe to RSS Feed
- Permalink
- Report Inappropriate Content
Hi,
maybe this helps?

based on your sample data:
LOAD pet_proj_nm,
     unique_id,
     prospect_score_cat,
     resp_open_ind,
     cnt_tran
FROM [http://community.qlik.com/thread/129247]
(html, codepage is 1252, embedded labels, table is @1);
regards
Marco
- Mark as New
- Bookmark
- Subscribe
- Mute
- Subscribe to RSS Feed
- Permalink
- Report Inappropriate Content
Perhaps you could try:
avg(aggr(sum(Field1),Dim1))
Where Field1 is Prospect_Cat_Score and Dim1 is the field you want to aggregate over, Frozen Atlanta and Frozen New York.
Word of caution though, you cannot average averages, the result will be incorrect. You should be using the absolute values to recalculate the average.
Hope that helps.
Matt
- Mark as New
- Bookmark
- Subscribe
- Mute
- Subscribe to RSS Feed
- Permalink
- Report Inappropriate Content
Hi Carey, were you able to solve this?
Best,
Matt
- Mark as New
- Bookmark
- Subscribe
- Mute
- Subscribe to RSS Feed
- Permalink
- Report Inappropriate Content
First: if you use the "UNIT (Frozen Atlanta)" like dimension, remove this.
Add expressions like this: Sum({<UNIT={'Frozen Atlanta'}>} VALUE) and named Frozen Atlanta. Repeat this to Fozen Brooklin.
For average add expression: AVG({<UNIT={'*'}>} VALUE) and named average.
- Mark as New
- Bookmark
- Subscribe
- Mute
- Subscribe to RSS Feed
- Permalink
- Report Inappropriate Content
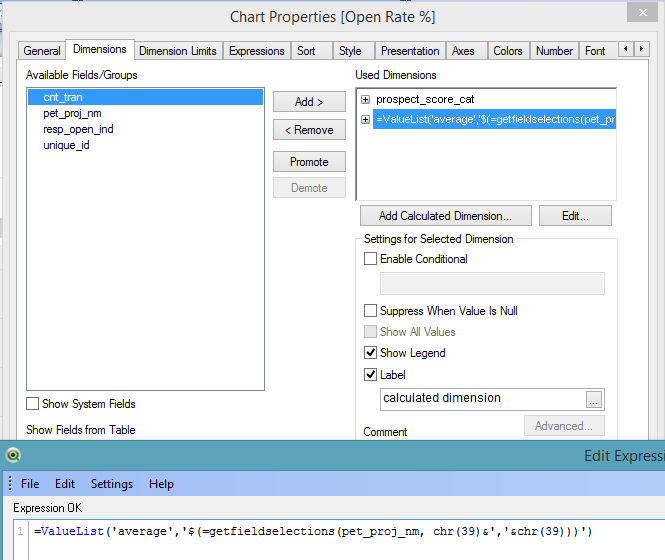
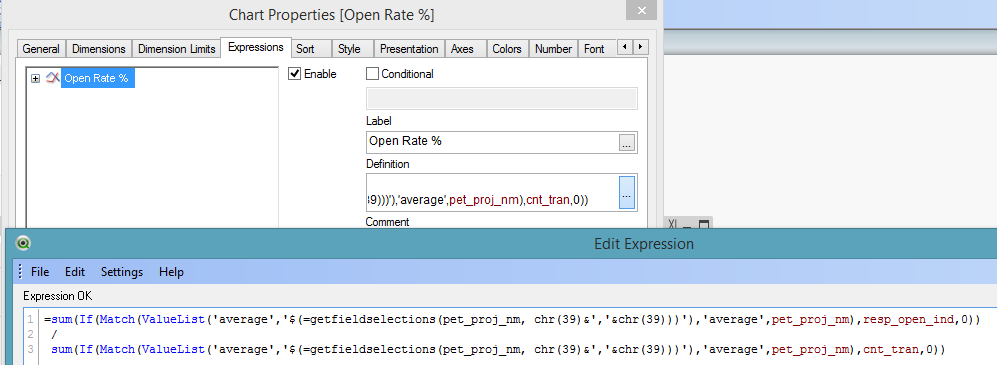
Thank you guys for your suggestions. The issue is, I don't want to hard code the expressions, since I'd like the user to be able to select the project names and then display the results accordingly. I've attached a screenshot of the two dimensions and the expression I have so far. The "pet_proj_nm" field corresponds to Frozen Atlanta etc, which should be dynamically selected.
- Mark as New
- Bookmark
- Subscribe
- Mute
- Subscribe to RSS Feed
- Permalink
- Report Inappropriate Content
can you please post some sample data
thanks
regards
Marco
- Mark as New
- Bookmark
- Subscribe
- Mute
- Subscribe to RSS Feed
- Permalink
- Report Inappropriate Content
Hi Carey,
If you attach some data I'm sure we'll solve this faster. In the meantime, let me make sure I understand what you need. You've got this expression:
sum(resp_open_ind)/sum(count_cst)
You want to calculate the overall average for each score category, right? To do this, you could try:
sum(total <prospect_score_cat > resp_open_ind)/sum(total<prospect_score_cat > count_cst)
The total <> will aggregate over prospect_score_cat while ignoring the categories. I think this will allow you to calculate the average.
Best,
Matt
- Mark as New
- Bookmark
- Subscribe
- Mute
- Subscribe to RSS Feed
- Permalink
- Report Inappropriate Content
Thank you all. Here are some sample data for two campaigns.
| pet_proj_nm | unique_id | prospect_score_cat | resp_open_ind | cnt_tran |
| Frozen - Atlanta | U_103089151 | 801-900 | 0 | 1 |
| Frozen - Atlanta | U_181230272 | 901-1000 | 0 | 1 |
| Frozen - Atlanta | U_93147111 | 901-1000 | 1 | 1 |
| Frozen - Atlanta | U_179205676 | 701-800 | 0 | 1 |
| Frozen - Atlanta | U_83974758 | 801-900 | 0 | 1 |
| Frozen - Atlanta | U_65797158 | 901-1000 | 1 | 1 |
| Frozen - Atlanta | U_68806048 | 801-900 | 1 | 1 |
| Frozen - Atlanta | U_77061818 | 801-900 | 0 | 1 |
| Frozen - Atlanta | U_175996931 | 901-1000 | 1 | 1 |
| Frozen - Atlanta | U_84699665 | 801-900 | 0 | 1 |
| Frozen - Atlanta | U_190622182 | 901-1000 | 0 | 1 |
| Frozen - Atlanta | U_63637894 | 801-900 | 0 | 1 |
| Frozen - Atlanta | U_171898435 | 801-900 | 0 | 1 |
| Frozen - Atlanta | U_177005746 | 801-900 | 0 | 1 |
| Frozen - Atlanta | U_182376476 | 901-1000 | 1 | 1 |
| Frozen - Atlanta | U_187151165 | 901-1000 | 1 | 1 |
| Frozen - Atlanta | U_197030067 | 101-200 | 0 | 1 |
| Frozen - Atlanta | U_62110649 | 701-800 | 0 | 1 |
| Frozen - Atlanta | U_193029294 | 801-900 | 0 | 1 |
| Frozen - Atlanta | U_192368656 | 701-800 | 1 | 1 |
| Frozen - Atlanta | U_184599878 | 701-800 | 0 | 1 |
| Frozen - Atlanta | U_62796611 | 901-1000 | 0 | 1 |
| Frozen - Atlanta | U_198194170 | 501-600 | 0 | 1 |
| Frozen - Atlanta | U_65645476 | 801-900 | 0 | 1 |
| Frozen - Atlanta | U_194627020 | 801-900 | 0 | 1 |
| Frozen - Atlanta | U_87018069 | 801-900 | 0 | 1 |
| Frozen - Atlanta | U_73016019 | 701-800 | 1 | 1 |
| Frozen - Atlanta | U_197628321 | 801-900 | 0 | 1 |
| Frozen - Brooklyn | U_78854528 | 701-800 | 0 | 1 |
| Frozen - Brooklyn | U_193333226 | 901-1000 | 0 | 1 |
| Frozen - Brooklyn | U_70315911 | 901-1000 | 0 | 1 |
| Frozen - Brooklyn | U_47777695 | 701-800 | 0 | 1 |
| Frozen - Brooklyn | U_195260574 | 901-1000 | 0 | 1 |
| Frozen - Brooklyn | U_191148379 | 901-1000 | 0 | 1 |
| Frozen - Brooklyn | U_88431645 | 801-900 | 0 | 1 |
| Frozen - Brooklyn | U_189185640 | 801-900 | 0 | 1 |
| Frozen - Brooklyn | U_188648180 | 801-900 | 0 | 1 |
| Frozen - Brooklyn | U_66749088 | 901-1000 | 0 | 1 |
| Frozen - Brooklyn | U_183496552 | 901-1000 | 0 | 1 |
| Frozen - Brooklyn | U_179399424 | 801-900 | 1 | 1 |
| Frozen - Brooklyn | U_192366521 | 701-800 | 0 | 1 |
| Frozen - Brooklyn | U_66962191 | 801-900 | 0 | 1 |
| Frozen - Brooklyn | U_182515681 | 801-900 | 0 | 1 |
| Frozen - Brooklyn | U_197041469 | 901-1000 | 0 | 1 |
| Frozen - Brooklyn | U_192882708 | 901-1000 | 0 | 1 |
| Frozen - Brooklyn | U_80302045 | 801-900 | 0 | 1 |
| Frozen - Brooklyn | U_184120826 | 701-800 | 0 | 1 |
| Frozen - Brooklyn | U_174324480 | 301-400 | 0 | 1 |
| Frozen - Brooklyn | U_198382941 | 701-800 | 0 | 1 |
| Frozen - Brooklyn | U_190374501 | 901-1000 | 0 | 1 |
Matt - Your suggestion did give me the average (red line in the picture); however, after adding that expression, I no longer see a separate line for each of the two campaigns. Instead, the blue line basically connects the value for the two campaigns within each score category.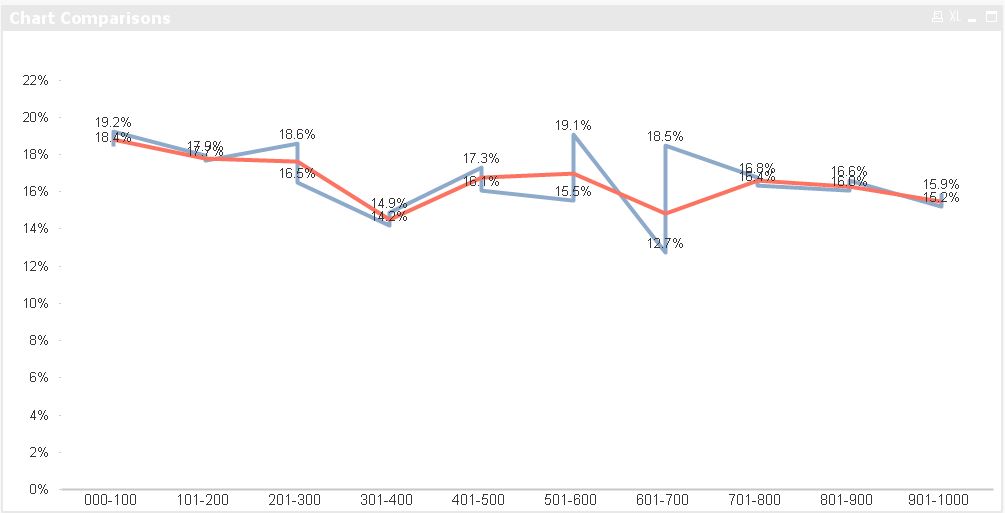
- Mark as New
- Bookmark
- Subscribe
- Mute
- Subscribe to RSS Feed
- Permalink
- Report Inappropriate Content
Hi Carey,
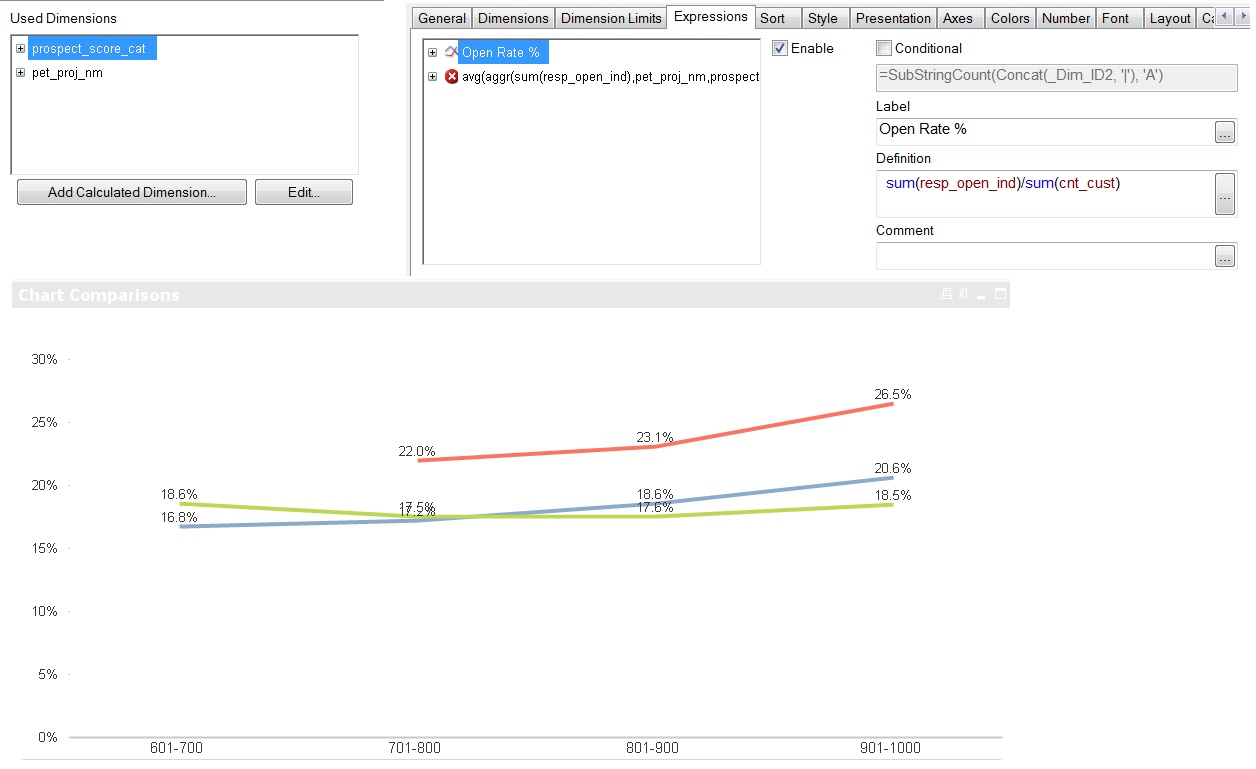
I can only get it to work if I specify Frozen Atlanta or Brooklyn in the expression, see attached. Looks like there may be a limitation to doing this if you use more than 1 dimension in the chart.
Hope that will work for you or perhaps someone else knows another way.
Matt
- Mark as New
- Bookmark
- Subscribe
- Mute
- Subscribe to RSS Feed
- Permalink
- Report Inappropriate Content
Yeah, thanks Matt. The second dimension seems to be the issue here, and unfortunately I can't remove that because we want to be dynamic based on the user's selection.
The alternative that I am using (for now) is to create a second chart that plots just the overall average, and overlay it on top - Definitely not desirable, but there does not appear to be another way. Greatly appreciate it if anybody else has other suggestions!
- « Previous Replies
-
- 1
- 2
- Next Replies »