Unlock a world of possibilities! Login now and discover the exclusive benefits awaiting you.
- Qlik Community
- :
- All Forums
- :
- QlikView App Dev
- :
- Bar Chart - Budget and Actual as Grouped - Sliced ...
- Subscribe to RSS Feed
- Mark Topic as New
- Mark Topic as Read
- Float this Topic for Current User
- Bookmark
- Subscribe
- Mute
- Printer Friendly Page
- Mark as New
- Bookmark
- Subscribe
- Mute
- Subscribe to RSS Feed
- Permalink
- Report Inappropriate Content
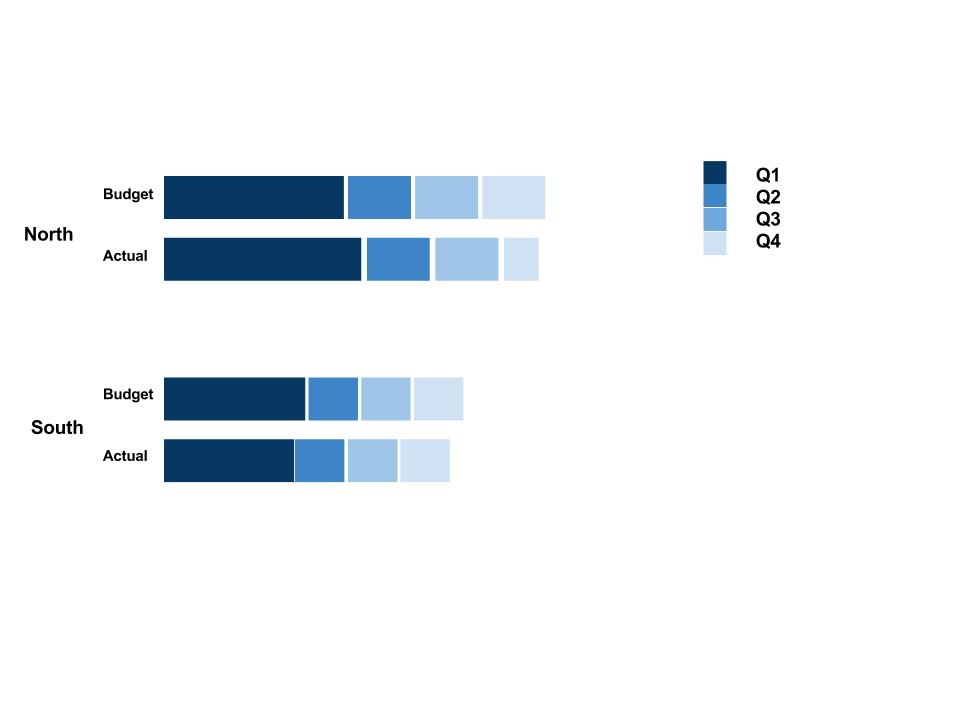
Bar Chart - Budget and Actual as Grouped - Sliced by Quarter
Is this possible? (In my opinion it's not very useful since the budget amounts are stacked; not 0-based (except for Q1); i.e. hard to compare Q2 to Q2. But it's what the client wants)
- Two dimensions (Division ('North', 'South'), and Quarter ('Q1', 'Q2', 'Q3', 'Q4')
- First-level group the Division dimension
- Stack the quarter slices
- Two expressions (SUM(Budget), SUM(Actual));
- Second-level Group these two expressions
Bar Chart - Budget and Actual as Grouped - Sliced by Quarter - Google Drawings
Accepted Solutions
- Mark as New
- Bookmark
- Subscribe
- Mute
- Subscribe to RSS Feed
- Permalink
- Report Inappropriate Content
Hi.
Yes it's possible. Assuming that you have Actual and Budget measures as different fields you can do the following.
Create a stacked bar chart with three dimensions:
Division
ValueList('Budget','Actual')
Quarter
And add the expression:
if(ValueList('Budget','Actual')='Actual', Sum (Actual), Sum (Budget))
Choose empty (space symbol) label for the ValueList('Budget','Actual') dimension.