Unlock a world of possibilities! Login now and discover the exclusive benefits awaiting you.
- Qlik Community
- :
- All Forums
- :
- QlikView App Dev
- :
- Bar Chart Columns Visibility
- Subscribe to RSS Feed
- Mark Topic as New
- Mark Topic as Read
- Float this Topic for Current User
- Bookmark
- Subscribe
- Mute
- Printer Friendly Page
- Mark as New
- Bookmark
- Subscribe
- Mute
- Subscribe to RSS Feed
- Permalink
- Report Inappropriate Content
Bar Chart Columns Visibility
Hello guys,
Currently I'm working in a new dashboard and I'm kind of blocked with a Bar Char property:
I have this expression in this chart:
(Sum({<Año = {$(vMaxYear)}>} Hl) / Sum({<Año = {$(=$(vMaxYear)-1)}>} Hl))-1
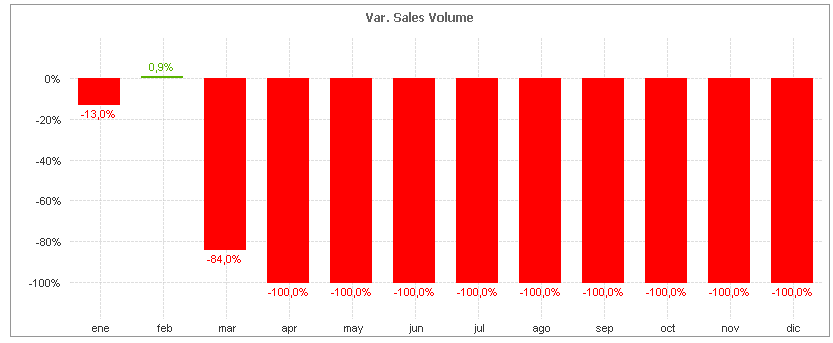
And I don't want to show the bars that are showing -100% due to the lack of data; for april 2018 I don't have any so the division is zero so I want to show it as a zero bar (or if there is another solution).
How can I do this?
Thank you very very much.
Accepted Solutions
- Mark as New
- Bookmark
- Subscribe
- Mute
- Subscribe to RSS Feed
- Permalink
- Report Inappropriate Content
May be this
If(Sum({<Año = {$(vMaxYear)}>} Hl) <> 0,
(Sum({<Año = {$(vMaxYear)}>} Hl) / Sum({<Año = {$(=$(vMaxYear)-1)}>} Hl))-1)
- Mark as New
- Bookmark
- Subscribe
- Mute
- Subscribe to RSS Feed
- Permalink
- Report Inappropriate Content
May be this
If(Sum({<Año = {$(vMaxYear)}>} Hl) <> 0,
(Sum({<Año = {$(vMaxYear)}>} Hl) / Sum({<Año = {$(=$(vMaxYear)-1)}>} Hl))-1)
- Mark as New
- Bookmark
- Subscribe
- Mute
- Subscribe to RSS Feed
- Permalink
- Report Inappropriate Content
Awesome!!! worked perfect.
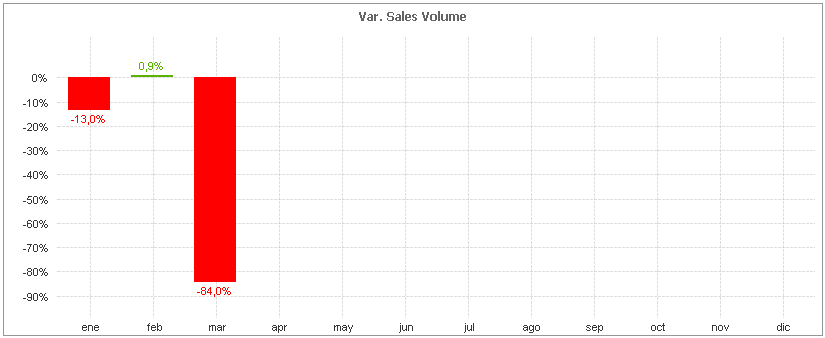 Then in presentation I unchecked "suppress Zero-values" and checked Zero on bars so I can have this: