Unlock a world of possibilities! Login now and discover the exclusive benefits awaiting you.
- Qlik Community
- :
- All Forums
- :
- QlikView App Dev
- :
- Bar Chart as a Gauge
- Subscribe to RSS Feed
- Mark Topic as New
- Mark Topic as Read
- Float this Topic for Current User
- Bookmark
- Subscribe
- Mute
- Printer Friendly Page
- Mark as New
- Bookmark
- Subscribe
- Mute
- Subscribe to RSS Feed
- Permalink
- Report Inappropriate Content
Bar Chart as a Gauge
Hi,
I wanted to modify the bar chart from the Executive Dashboard to my needs, but not sure how..
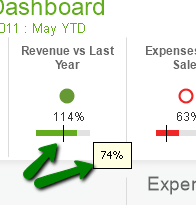
for example: Revenue vs Last year
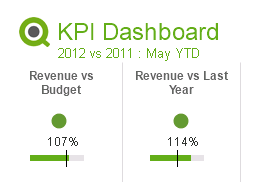
The current expressions are based on ratios.
The green bar:
=Sum({<[Fiscal Year]={$(=vYTDYear)}, FiscalMonthNum={"<=$(vCurrentMonthNum)"}>}[Sales Price]*[Sales Quantity])/Sum({<[Fiscal Year]={$(=(vYTDYear)-1)}, FiscalMonthNum={"<=$(vCurrentMonthNum)"}>}[Sales Price]*[Sales Quantity])
The Grey bar:
1.5 - [Revenue vs Last Year]
The presentation line (Target)
0.65*Sum({<[Fiscal Year]={$(=vYTDYear)}, FiscalMonthNum={"<=$(vCurrentMonthNum)"}>}[Sales Price]*[Sales Quantity])/Sum({<[Fiscal Year]={$(=(vYTDYear)-1)}, FiscalMonthNum={"<=$(vCurrentMonthNum)"}>}[Sales Price]*[Sales Quantity])
In my case, the target has to be the revenue of last year .
Any idea how I can achieve this with the current barchart?
Thanks!
- Mark as New
- Bookmark
- Subscribe
- Mute
- Subscribe to RSS Feed
- Permalink
- Report Inappropriate Content
Not entirely sure what you have and what you are looking to change? Can you may be share a sample and elaborate with an example from the sample?
- Mark as New
- Bookmark
- Subscribe
- Mute
- Subscribe to RSS Feed
- Permalink
- Report Inappropriate Content
Hi Sunny,
In the current gauge, The bars are based on ratio, and the target is calculated as a percentage of the the ratio between the revenue of periods: current year (YTD) and previous year (PYTD):
0.65*114
In my case, the target should be the revenue of the previous year period (PYTD).
That means that I should also change the expression of the bars (from ratio to the revenue sum)?
If it's still not clear, i'll create a sample.. 🙂
Thanks!
- Mark as New
- Bookmark
- Subscribe
- Mute
- Subscribe to RSS Feed
- Permalink
- Report Inappropriate Content
Hi,
I think that what I should do is replace the expression of reference line to 1 (100%).
To represent a ratio of 1 between the 2 periods..
- Mark as New
- Bookmark
- Subscribe
- Mute
- Subscribe to RSS Feed
- Permalink
- Report Inappropriate Content
I am not confident that I understand what you are looking to do.
- Mark as New
- Bookmark
- Subscribe
- Mute
- Subscribe to RSS Feed
- Permalink
- Report Inappropriate Content
I wanted to use the bar chart to compare revenues in 2 periods (current and previous).
The green bar shows the ratio of the revenues.
I was struggling with the reference line to display the target, which is to have the same revenue as the previous period.
(or a ratio of 1). So i figure the reference line should be 1 (or 100%).
The left bar chart in my screen capture (Revenue vs Budget) shows it.
But i'm not sure that a bar chart is really needed in such a case, i.e., when the target is 100%.
Thanks....