Unlock a world of possibilities! Login now and discover the exclusive benefits awaiting you.
- Qlik Community
- :
- All Forums
- :
- QlikView App Dev
- :
- Bar chart and trend line with calculation
Options
- Subscribe to RSS Feed
- Mark Topic as New
- Mark Topic as Read
- Float this Topic for Current User
- Bookmark
- Subscribe
- Mute
- Printer Friendly Page
Turn on suggestions
Auto-suggest helps you quickly narrow down your search results by suggesting possible matches as you type.
Showing results for
Not applicable
2016-05-31
06:08 AM
- Mark as New
- Bookmark
- Subscribe
- Mute
- Subscribe to RSS Feed
- Permalink
- Report Inappropriate Content
Bar chart and trend line with calculation
I have the sales data this way
| Jan | 13 |
| Feb | 20 |
| Mar | 15 |
| Apr | 9 |
| May | 5 |
| Jun | |
| jul | |
| Aug | |
| Sep | |
| Oct | |
| Nov | |
| Dec |
I need to show the same as bar chart with cumulative month values. and then add a trendline to the data till dec
final outcome should be something like
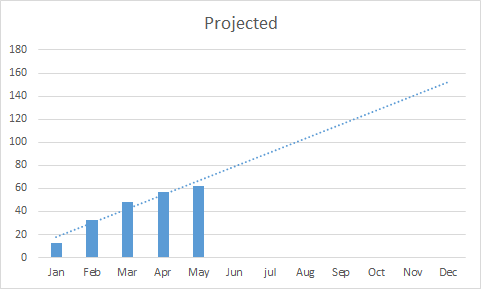
how can do it in Qlikview
158 Views
0 Replies