Unlock a world of possibilities! Login now and discover the exclusive benefits awaiting you.
- Qlik Community
- :
- All Forums
- :
- QlikView App Dev
- :
- Bar chart data points - is it possible to display ...
- Subscribe to RSS Feed
- Mark Topic as New
- Mark Topic as Read
- Float this Topic for Current User
- Bookmark
- Subscribe
- Mute
- Printer Friendly Page
- Mark as New
- Bookmark
- Subscribe
- Mute
- Subscribe to RSS Feed
- Permalink
- Report Inappropriate Content
Bar chart data points - is it possible to display more than one value?
Hello all.
I have a bar chart which displays the number of calls logged per group – values on data points is checked.
I would also like to display the number of incidents logged per group as a percentage of the total number of incidents logged.
I thought a dual expression might do the trick but no luck: =dual(count(CALLREF),count(CALLREF)/vCallsCount)
I would be grateful for any suggestions.
Many thanks, Michael.
Accepted Solutions
- Mark as New
- Bookmark
- Subscribe
- Mute
- Subscribe to RSS Feed
- Permalink
- Report Inappropriate Content
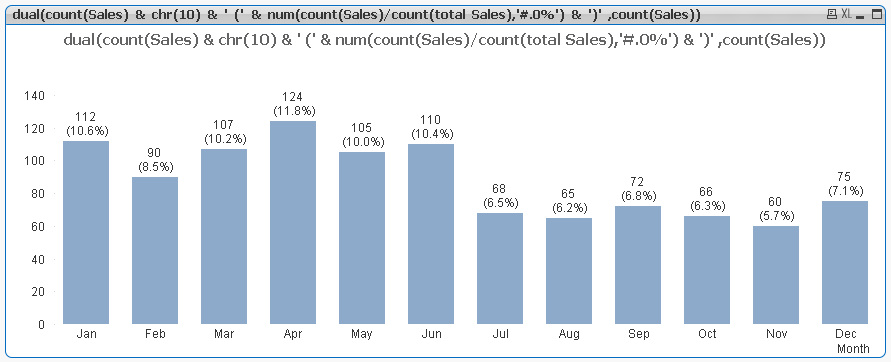
Well, it's possible. But it probably won't look to good. The dual function creates a value with a numeric and a text representation. You can use the text part to construct the two values you want to show. See below image where both the count itself as the percentage of the total count is shown:
talk is cheap, supply exceeds demand
- Mark as New
- Bookmark
- Subscribe
- Mute
- Subscribe to RSS Feed
- Permalink
- Report Inappropriate Content
That’s exactly what I was after – thanks very much.