Unlock a world of possibilities! Login now and discover the exclusive benefits awaiting you.
- Qlik Community
- :
- All Forums
- :
- QlikView App Dev
- :
- Bar chart with columns and rows
Options
- Subscribe to RSS Feed
- Mark Topic as New
- Mark Topic as Read
- Float this Topic for Current User
- Bookmark
- Subscribe
- Mute
- Printer Friendly Page
Turn on suggestions
Auto-suggest helps you quickly narrow down your search results by suggesting possible matches as you type.
Showing results for
Not applicable
2012-05-15
02:03 PM
- Mark as New
- Bookmark
- Subscribe
- Mute
- Subscribe to RSS Feed
- Permalink
- Report Inappropriate Content
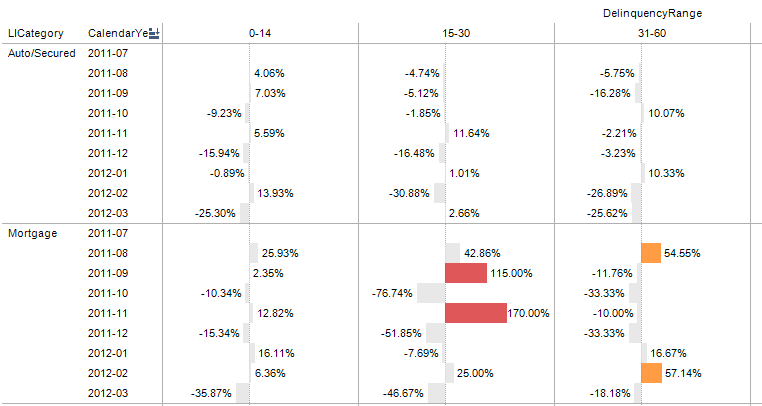
Bar chart with columns and rows
Hi,
I am trying do create a bar chart with both columns and rows and highlight the differences from the prior month where the differences is above a certain percent. This was done in another BI tool. Is is possible to show data in this way with Qlikview? I was having difficulty showing data along both colums and rows in a bar chart.
261 Views
0 Replies