Unlock a world of possibilities! Login now and discover the exclusive benefits awaiting you.
- Qlik Community
- :
- All Forums
- :
- QlikView App Dev
- :
- Bar charts - filtering by MM-DD-YYYY with a MMM/YY...
- Subscribe to RSS Feed
- Mark Topic as New
- Mark Topic as Read
- Float this Topic for Current User
- Bookmark
- Subscribe
- Mute
- Printer Friendly Page
- Mark as New
- Bookmark
- Subscribe
- Mute
- Subscribe to RSS Feed
- Permalink
- Report Inappropriate Content
Bar charts - filtering by MM-DD-YYYY with a MMM/YYYY value
Hi,
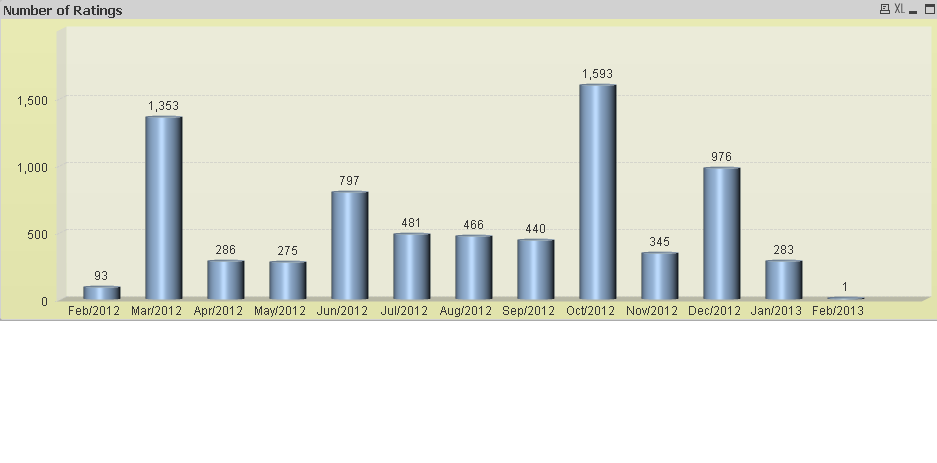
I have a bar chart, with a single Dimension of a date, formatted by "MMM/YYYY". The purpose of the bar chart is to allow the user to filter the full dataset (which is on a separate tab), down to the dates defined by the selected MMM/YYYY value. For example, if the user selects Feb/2012 from the bar chart, the dataset on the other tab should be filtered down to the records with a date (MM-DD-YYYY) of 02-nn-2012 - therefore, all dates in February 2012 are returned from the full dataset. The field that is being used as the dimension for the bar chart cannot include a Day value because the bar chart needs to be grouped by month.
Here's the problem - the dataset needs to filter down to the dates in the current month (i.e. February 2012) that are >= Today(). Therefore, as today is February 9th, any records with a date between February 1st and February 8th should be filtered out; the expression for the bar chart values already has logic to return the correct number of records. For example, if the bar chart returns 93 rows with a date between 9th February 2012 and the end of February 2012, if the user clicks on the Feb/2012 value, the filtered dataset returns 100 rows - because it is including 7 rows with dates between February 1st and February 8th, because only the month and year value (MMM/YYYY) is being passed back from the bar chart.
Is there some way to write code to determine the following pseudo logic - if the chosen month is the current month, then return only those rows where the Day value is >= today's Day value, else if the chosen month is NOT the current month, then return all rows with dates within the chosen month? I get the feeling this is perhaps asking too much of QlikView, but any help would be appreciated.
Thanks,
V B
- Mark as New
- Bookmark
- Subscribe
- Mute
- Subscribe to RSS Feed
- Permalink
- Report Inappropriate Content
Hi,
Please try the sample expression below
=If(Max(Month) = Month(Today()) AND Max(Year) = Year(Today()),
Sum({<DateField={'>=$(=Today())'}>} Sales),
Sum(Sales))
Hope this helps you.
Regards,
Jagan.
- Mark as New
- Bookmark
- Subscribe
- Mute
- Subscribe to RSS Feed
- Permalink
- Report Inappropriate Content
OK - I think I understand what's going on....your fact table has dates to the day level but also a month field. You have a bar chart on this fact table where your dimension is MONTH and your expression is something like
=IF(MONTH = Date(Today(),'MMM/YYYY'),Sum({<Date = {">Today()"}>} Something),Sum(Something))
Hope I'm correct so far...
When you click on a bar in the chart you want QV to do it's normal selection stuff EXCEPT if the month is the current month, in which case you should get a result set of the remaining days of this month. Sounds like a trigger is needed...
In Settings > Document Properties > Triggers, choose MONTH in the Field Event Triggers and add an OnSelect action of Selection > Select in Field, put "Date" (or whatever your single-day field is called) into Field and in the search string box put =IF(MONTH=Date(Today(),'MMM/YYYY'),'=Date>today()')
BEWARE: Triggers can be fiddly. If OnSelect doesn't work try OnChange. And be careful with triggers as they can clash with eachother quite easily. Also, sometimes your back button will play up when trying to reverse trigger actions...
Hope this helps (and works!),
Jason
Message was edited by: Jason Michaelides - changed MMMM/YYYY to MMM/YYYY