Unlock a world of possibilities! Login now and discover the exclusive benefits awaiting you.
- Qlik Community
- :
- All Forums
- :
- QlikView App Dev
- :
- Bubble Chart To Aid the Capital Budgetting Process
- Subscribe to RSS Feed
- Mark Topic as New
- Mark Topic as Read
- Float this Topic for Current User
- Bookmark
- Subscribe
- Mute
- Printer Friendly Page
- Mark as New
- Bookmark
- Subscribe
- Mute
- Subscribe to RSS Feed
- Permalink
- Report Inappropriate Content
Bubble Chart To Aid the Capital Budgetting Process
Hello,
I have been tasked to create a bubble chart that allows senior management to make strategic decisions as part of the capital budgetting process. As an FYI, currently the data for capital budgetting is married with project or idea data from Clarity on a spreadsheet and then fed into QlikView. We are in the beginning of the process where we are not yet collecting all the data elements we need. So I have created some fictitious data to create my bubble chart.
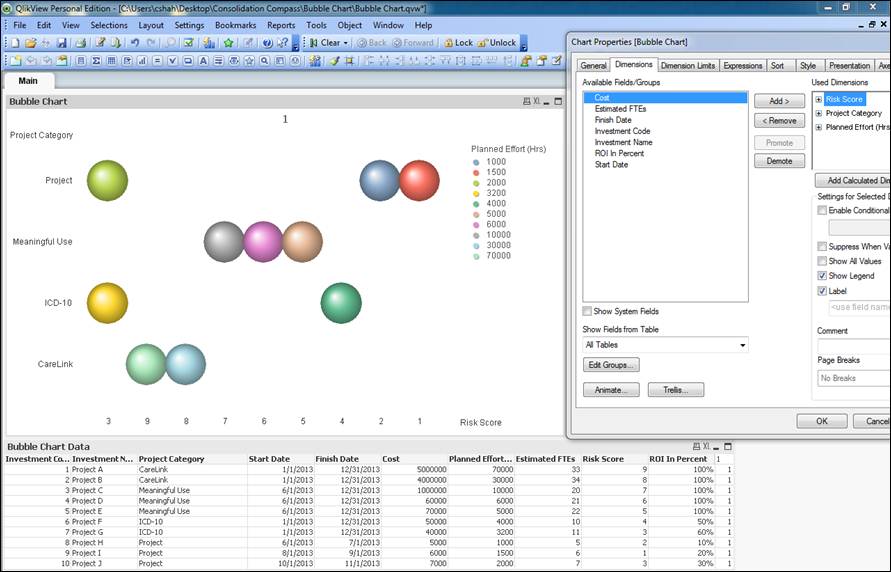
My Boss would like me to plot business category (strategic/patient saftety etc.) on the Y Axis, Risk Score on the X axis, and the size of the bubble, Z, is Planned Effort in hours. He would like the color of the bubble to be the cost.
My first question: After reading up on some information on Bubble charts and how they are created in Excel, am i limited to only three data points? X, Y, and Z. If not, i'm not sure how to represent cost as color.
My second question: In a simple bar chart or pie chart, i'm usually ok with expressions, however, i'm not sure what the expression should be here. For now, i just put 1=1.
My last question for now: I have set Z (planned effort in hours) to be different values so i'm not sure what i'm missing and why my bubble is the same sizes.
Thank you in advance for your help.
Accepted Solutions
- Mark as New
- Bookmark
- Subscribe
- Mute
- Subscribe to RSS Feed
- Permalink
- Report Inappropriate Content
Hin Cintal, First question: You can represent color by changing the "backgrund color" on your expression. Please see attached. Second Question: Since you put 1=1 as you expression all your bubble are of the same size. I would assume that you here want the expression sum ([Planned Effort (Hrs)]) . This will lead to that "big project" are getting big bubbles. Last question: Your bubbles are of the same size due to your expression 1=1. br Paul
- Mark as New
- Bookmark
- Subscribe
- Mute
- Subscribe to RSS Feed
- Permalink
- Report Inappropriate Content
Hi there,
upload your .qvw and i Can have look at it,
br
Paul
- Mark as New
- Bookmark
- Subscribe
- Mute
- Subscribe to RSS Feed
- Permalink
- Report Inappropriate Content
Thank Paul. See attached files.
- Mark as New
- Bookmark
- Subscribe
- Mute
- Subscribe to RSS Feed
- Permalink
- Report Inappropriate Content
Hin Cintal, First question: You can represent color by changing the "backgrund color" on your expression. Please see attached. Second Question: Since you put 1=1 as you expression all your bubble are of the same size. I would assume that you here want the expression sum ([Planned Effort (Hrs)]) . This will lead to that "big project" are getting big bubbles. Last question: Your bubbles are of the same size due to your expression 1=1. br Paul
- Mark as New
- Bookmark
- Subscribe
- Mute
- Subscribe to RSS Feed
- Permalink
- Report Inappropriate Content
Thank you so much. Haha, i feel so retarted when the solution is so simple. Thank you again for explaining it properly as well.
Chintal