Unlock a world of possibilities! Login now and discover the exclusive benefits awaiting you.
- Qlik Community
- :
- All Forums
- :
- QlikView App Dev
- :
- Re: Built a Pie in a straight table
- Subscribe to RSS Feed
- Mark Topic as New
- Mark Topic as Read
- Float this Topic for Current User
- Bookmark
- Subscribe
- Mute
- Printer Friendly Page
- Mark as New
- Bookmark
- Subscribe
- Mute
- Subscribe to RSS Feed
- Permalink
- Report Inappropriate Content
Built a Pie in a straight table
Hello,
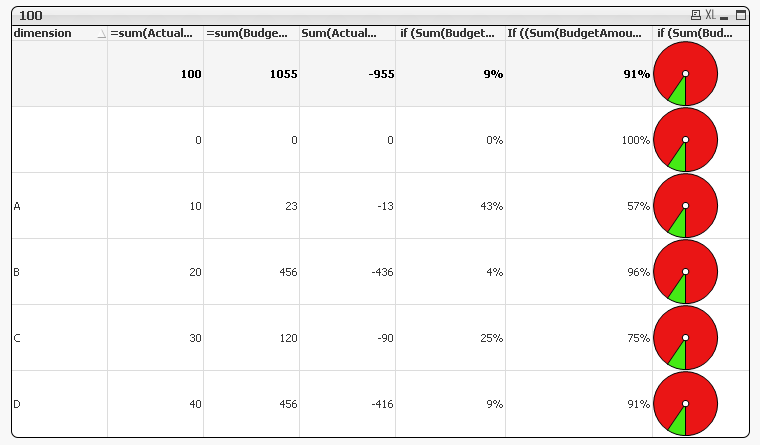
Is it possible to build a pie in a straight table ( see attachment)
I have a straight table with one Dimension (CompanyNumber) and 5 expressions:
1) Sum(BudgetAmount)
2) Sum(ActualAmount)
3) Sum(ActualAmount) - Sum(BudgetAmount)
4) if (Sum(BudgetAmount) > 0, Sum(ActualAmount) / Sum(BudgetAmount), 0)
5) If ((Sum(BudgetAmount) - Sum(ActualAmount))/ Sum(BudgetAmount)> 0, (Sum(BudgetAmount) - Sum(ActualAmount))/ Sum(BudgetAmount), 1)
If I create a Pie, I use 4 and 5 to build the two Pie-parts, so 4 + 5 is the hole pie
I had created a straight table and a trellisbox with pies for every Company one pie.
Now my Managers wants that I integrate the pies into the straight table. But I don't know how I can do that with the expressions I have,
even don't know if it is possible at all
So I could use some help
Thanks in regards
Court
- « Previous Replies
-
- 1
- 2
- Next Replies »
- Mark as New
- Bookmark
- Subscribe
- Mute
- Subscribe to RSS Feed
- Permalink
- Report Inappropriate Content
Extra Information:
There was such a kind of question in the past: Solution was : go to chart properties -> Select expression -> Display option -> representation -> select mini Chartdate and in Mini chart settings Select Dimension of the straight table and mode is available there.
When I do that I only have the mode Options:Sparkline, Line with dots, Bars and Whiskers.
So I think that is not the right solution, if there is a solution
- Mark as New
- Bookmark
- Subscribe
- Mute
- Subscribe to RSS Feed
- Permalink
- Report Inappropriate Content
It might be possible, but not sure how to make the widths dynamic based on the dimension... sorry don't have more time to play but will fiddle later!
- Mark as New
- Bookmark
- Subscribe
- Mute
- Subscribe to RSS Feed
- Permalink
- Report Inappropriate Content
Hello Adam,
Pity you have no more time to explain how you can do it, watching your Image. Hope to hear from you later
Court
- Mark as New
- Bookmark
- Subscribe
- Mute
- Subscribe to RSS Feed
- Permalink
- Report Inappropriate Content
Hi Court,
I added the qvw for you as well.
Basically it is just a circular gauge with lots of bits turned off and the segment set to the expression
- Mark as New
- Bookmark
- Subscribe
- Mute
- Subscribe to RSS Feed
- Permalink
- Report Inappropriate Content
Thanks Adam,
When I am logged on I don't see if a file is added to the message.
But thanks for the qvw, downloaded and will open it and learn from it.
I will try it myself,
Keep you informed
Court
- Mark as New
- Bookmark
- Subscribe
- Mute
- Subscribe to RSS Feed
- Permalink
- Report Inappropriate Content
stalwar1 can you think how to adapt the segment formula to fire for each dimension rather than the object as a whole?
- Mark as New
- Bookmark
- Subscribe
- Mute
- Subscribe to RSS Feed
- Permalink
- Report Inappropriate Content
this idea isn't the best as you can't use mini charts in a pivot either....
- Mark as New
- Bookmark
- Subscribe
- Mute
- Subscribe to RSS Feed
- Permalink
- Report Inappropriate Content
thought this might work but it doesn't
=PICK(MATCH(dimension,'A','B','C','D','E'),Sum({<dimension={'A'}>}ActualAmount) / Sum({<dimension={'A'}>}BudgetAmount),
Sum({<dimension={'B'}>}ActualAmount) / Sum({<dimension={'B'}>}BudgetAmount),
Sum({<dimension={'C'}>}ActualAmount) / Sum({<dimension={'C'}>}BudgetAmount),
Sum({<dimension={'D'}>}ActualAmount) / Sum({<dimension={'D'}>}BudgetAmount),
Sum({<dimension={'E'}>}ActualAmount) / Sum({<dimension={'E'}>}BudgetAmount))
- Mark as New
- Bookmark
- Subscribe
- Mute
- Subscribe to RSS Feed
- Permalink
- Report Inappropriate Content
Hello Adam,
I have build in your way of define pies in a straight table.
At the Moment Managers are happy that they have their pies.
But I'm wondering how it works because in a normal pie there are two expressions.
In the Pies I just build in, I could only see one Expression
Hope you can explain me so I can learn more and more
Thanks
Court
- « Previous Replies
-
- 1
- 2
- Next Replies »