Unlock a world of possibilities! Login now and discover the exclusive benefits awaiting you.
- Qlik Community
- :
- All Forums
- :
- QlikView App Dev
- :
- CALENDAR MEASURE YTD Last Year
- Subscribe to RSS Feed
- Mark Topic as New
- Mark Topic as Read
- Float this Topic for Current User
- Bookmark
- Subscribe
- Mute
- Printer Friendly Page
- Mark as New
- Bookmark
- Subscribe
- Mute
- Subscribe to RSS Feed
- Permalink
- Report Inappropriate Content
CALENDAR MEASURE YTD Last Year
Hi
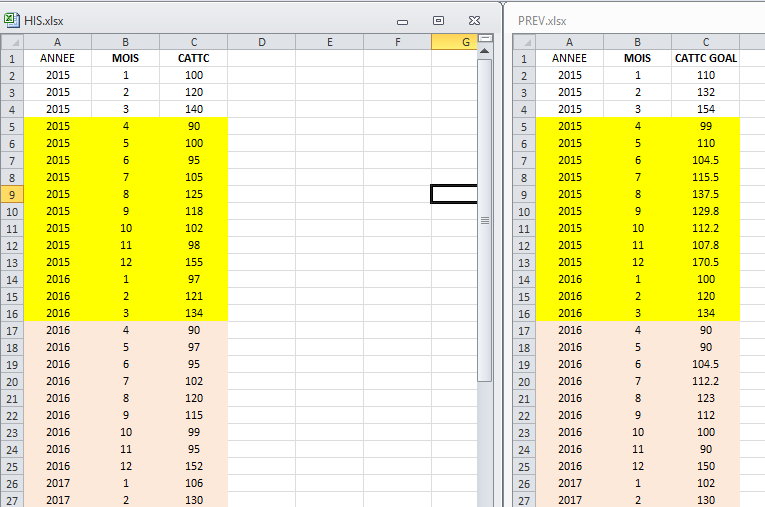
To explain my issue i created a simple sample ;
I have 2 files with common dates (3 years ) as shown
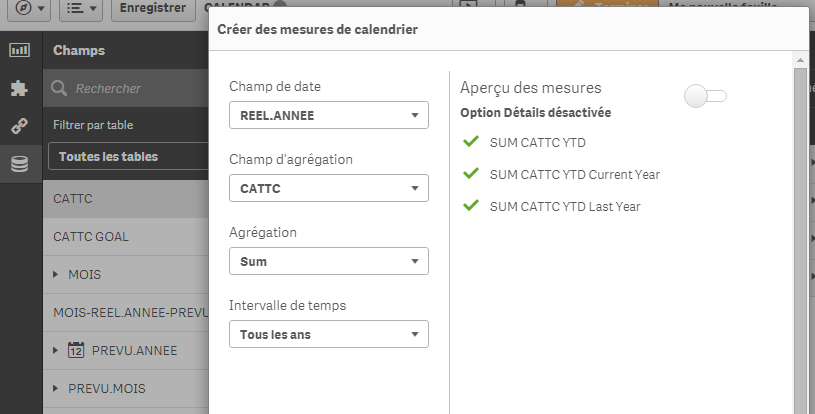
Then I created a calendar measure on CATTC field
So now, i want to create a graph with comparative analysis CATTC historical / real / goal over th entire periode (obviously 2 years about the historical)
I obtain that
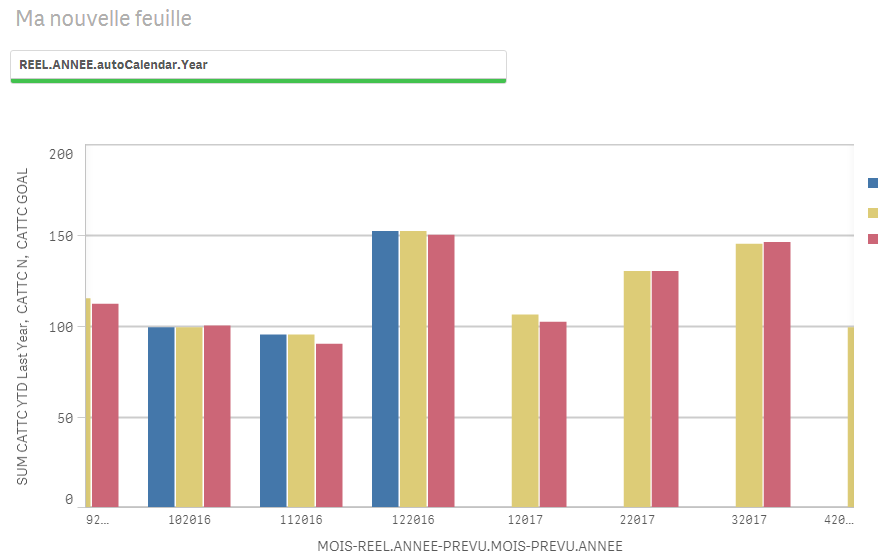
my issue :
CATTC real = CATTC last Year on 2016
No CATTC historical on 2017
as you see, i don't understand the basic concept 😞
I need some help
regards
Philippe
- Mark as New
- Bookmark
- Subscribe
- Mute
- Subscribe to RSS Feed
- Permalink
- Report Inappropriate Content
Hi everybody
Let me add another visualisation to illustrate my issue.
here i only selected Year 2016
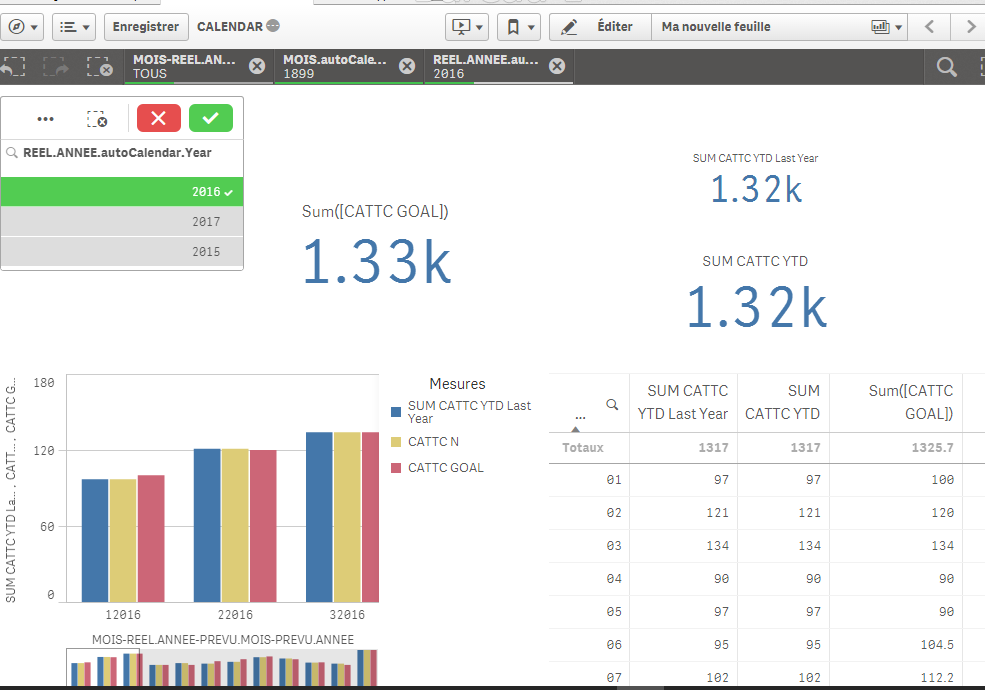
as you see, year and last year are strictly equal (year value)
i didn't change the automatic expression below
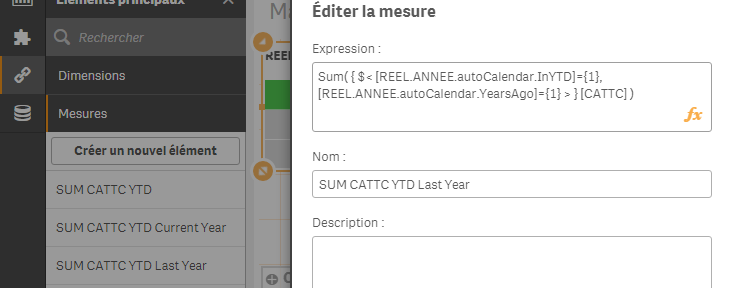
May be should I ???
don't understand 🙂
regards
Philippe