Unlock a world of possibilities! Login now and discover the exclusive benefits awaiting you.
- Qlik Community
- :
- All Forums
- :
- QlikView App Dev
- :
- Re: Calcualted Dimension Question
- Subscribe to RSS Feed
- Mark Topic as New
- Mark Topic as Read
- Float this Topic for Current User
- Bookmark
- Subscribe
- Mute
- Printer Friendly Page
- Mark as New
- Bookmark
- Subscribe
- Mute
- Subscribe to RSS Feed
- Permalink
- Report Inappropriate Content
Calcualted Dimension Question
I'd like to create a straight table with an undefined dimension. They are actual 3 distinct (and sometimes overlapping) sets...
<Fiscal Year = {$(vMaxFY -1)}> ex. 2011
<[Fiscal Year]={$(=vMaxYear-1)}
,[Fiscal Period] = {"<=$(=vMaxFPinMaxFY)"} > ex. 2011 YTD
and
<Fiscal Year = {$(vMaxFY)}> ex. 2012 YTD
I have the following expressions.
Sum([Total Cost]) , Count([SSN]) , Avg([Total Cost])
I'm currently doing this with 9 text boxes, but I feel like a straight table would be a better solution.
Can someone provide some guidance???
Thanks and best regards,
Keith
- Mark as New
- Bookmark
- Subscribe
- Mute
- Subscribe to RSS Feed
- Permalink
- Report Inappropriate Content
Maybe someone can correct me, but I am not sure this is possible in one straight table because your dimension rows (in this case your time periods) are overlapping. I would create 3 tables of one row each, run horizontally, still "dimensionless" with each of your three set types. I would do the 2011 one with a header row so you can label the expressions and then suppress the headers on the other two so I could align them up close to the first table so they appear as one table.
- Mark as New
- Bookmark
- Subscribe
- Mute
- Subscribe to RSS Feed
- Permalink
- Report Inappropriate Content
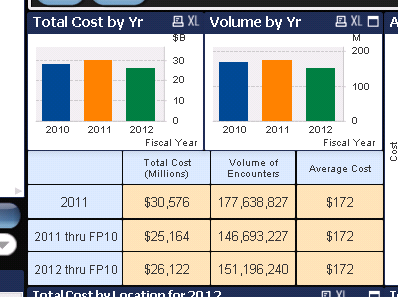
I'm adding a picture of what is being displayed right now...
- Mark as New
- Bookmark
- Subscribe
- Mute
- Subscribe to RSS Feed
- Permalink
- Report Inappropriate Content
What you have done by putting together all these text boxes is not bad and probably now that it is done, leave it alone??? But it will be a hassle when you want to move the beast around so it might be worth the work to get it into three tables that look as one rather than 9+ text boxes that look as one. Regardless, neither solution would give you one table. I drew this up in MS Excel to show you what I would do:
Table 1 (with Headers)
| Total Cost (Millions) | Volume of Encounters | Average Cost | |
| 2011 | SUM({<Fiscal Year = {$(vMaxFY -1)}>} [Total Cost]) | COUNT({<Fiscal Year = {$(vMaxFY -1)}>} SSN) | AVG({<Fiscal Year = {$(vMaxFY -1)}>} [Total Cost]) |
Table 2
| 2011 thru FP10 | SUM({<[Fiscal Year]={$(=vMaxYear-1)} ,[Fiscal Period] = {"<=$(=vMaxFPinMaxFY)"} > } [Total Cost]) | COUNT({<[Fiscal Year]={$(=vMaxYear-1)} ,[Fiscal Period] = {"<=$(=vMaxFPinMaxFY)"} > } SSN) | AVG({<[Fiscal Year]={$(=vMaxYear-1)} ,[Fiscal Period] = {"<=$(=vMaxFPinMaxFY)"} > } [Total Cost]) |
Table 3
| 2012 thru FP10 | SUM({<Fiscal Year = {$(vMaxFY)}>} [Total Cost]) | COUNT({<Fiscal Year = {$(vMaxFY)}>} SSN) | AVG({<Fiscal Year = {$(vMaxFY)}>} [Total Cost]) |
Hope this helps.