Unlock a world of possibilities! Login now and discover the exclusive benefits awaiting you.
- Qlik Community
- :
- All Forums
- :
- QlikView App Dev
- :
- Re: Expresion Calculada
- Subscribe to RSS Feed
- Mark Topic as New
- Mark Topic as Read
- Float this Topic for Current User
- Bookmark
- Subscribe
- Mute
- Printer Friendly Page
- Mark as New
- Bookmark
- Subscribe
- Mute
- Subscribe to RSS Feed
- Permalink
- Report Inappropriate Content
Calculated expresion (Expresion Calculada)
Good afternoon,
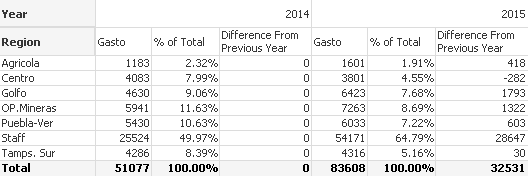
I have a pivot table with 2 expressions (Expenditure and% spent), something like this:
And I want the expression called "Difference" The difference between the metric spending 2015 vs metric Expense 2014, ie, the difference in spending between each year is calculated, obvious is calculated field Difference in 2014 should zero as it has a prior year against which to compare, but in the case of 2015 should subtract for example for the region Op Mining 7253 -. 5941.
Then I put in the expression Difference:
= Column (4)-column (1)
but does not throw me any value, how I can do?
We appreciate your help
Translated with Google Translate - Qlik Community Administrative Team
Buenas tardes
Tengo una table pivote con 2 expresiones (Gasto y %Gastado), algo asi:
Y quiero que en la expression llamada "Diferencia" se calcule la diferencia que hay entre la metrica Gasto 2015 vs la métrica Gasto 2014, es decir, que se calcule la diferencia del gasto entre cada año, obvio el campo de Diferencia en el 2014 debe ser cero pues no tiene un año previo contra el cual comparar, pero para el caso del año 2015 debe restar por ejemplo para la region Op. Mineras 7253 - 5941.
Entonces puse en la expression Diferencia:
=Column(4)-Column(1)
pero no me arroja ningún valor, como le puedo hacer?
Les agradezco su ayuda
- Mark as New
- Bookmark
- Subscribe
- Mute
- Subscribe to RSS Feed
- Permalink
- Report Inappropriate Content
Hi Rocio
From what you describe I think this is the result you wish to achieve:
To begin I copied the data from your table to create a fact table:
| Region | Gasto | Year |
| OP.Mineras | 5941 | 2014 |
| OP.Mineras | 7263 | 2015 |
| Staff | 25524 | 2014 |
| Staff | 54171 | 2015 |
| Puebla-Ver | 5430 | 2014 |
| Puebla-Ver | 6033 | 2015 |
| Golfo | 4630 | 2014 |
| Golfo | 6423 | 2015 |
| Centro | 4083 | 2014 |
| Centro | 3801 | 2015 |
| Agricola | 1183 | 2014 |
| Agricola | 1601 | 2015 |
| Tamps. Sur | 4286 | 2014 |
| Tamps. Sur | 4316 | 2015 |
I then created a pivot table using Region and Year as the dimensions with the following expressions:
Gasto: Sum (Gasto)
% of Total: Num(Sum(Gasto) /Sum(TOTAL <[Year]> Gasto) ,'0.00%')
Difference from previous year: Sum(Gasto-aggr(above(sum({<Year=>} Gasto)), Region, Year))
The order of the fields in the aggregation statement is critical in this expression.
The resulting calculated fields give you the difference between the value against the region in the current year compared to the value in the region in the previous year.
I hope that helps.
Kind regards
Steve
PS I will put this through Google translate to attempt to turn it into Spanish for you.
/********************************************************************************************************************************/
Hola Rocio
De lo que usted describe Creo que este es el resultado que se desea lograr :

Para empezar he copiado los datos de su tabla para crear una tabla de hechos :
| Region | Gasto | Year |
| OP.Mineras | 5941 | 2014 |
| OP.Mineras | 7263 | 2015 |
| Staff | 25524 | 2014 |
| Staff | 54171 | 2015 |
| Puebla-Ver | 5430 | 2014 |
| Puebla-Ver | 6033 | 2015 |
| Golfo | 4630 | 2014 |
| Golfo | 6423 | 2015 |
| Centro | 4083 | 2014 |
| Centro | 3801 | 2015 |
| Agricola | 1183 | 2014 |
| Agricola | 1601 | 2015 |
| Tamps. Sur | 4286 | 2014 |
| Tamps. Sur | 4316 | 2015 |
Gasto: Sum (Gasto)
% Del Total: Num(Sum(Gasto) /Sum(TOTAL <[Year]> Gasto) ,'0.00%')
Diferencia con el año anterior: Sum(Gasto-aggr(above(sum({<Year=>} Gasto)), Region, Year))
El orden de los campos en el estado de agregación es crítico en esta expresión. Los campos calculados resultantes le dan la diferencia entre el valor en contra de la región en el año actual en comparación con el valor en la región en el año anterior.
Espero que eso ayude.
saludos cordiales
Steve
PS pondré esto a través de Google Translate para intentar convertirlo en español para ti.
- Mark as New
- Bookmark
- Subscribe
- Mute
- Subscribe to RSS Feed
- Permalink
- Report Inappropriate Content
Muchas gracias,
Lo hice de la forma en que me indicas, pero no se porque no me esta funcionando, me arroja el valor del gasto del año anterior en lugar de la diferencia que hay entre el gasto de un año y otro.
No se que podra ser, ya que esta exactamente como me indicas:
=Sum(Gastos_MXN-Aggr(above(sum({<Año=>} Gastos_MXN)), Region, Año))
- Mark as New
- Bookmark
- Subscribe
- Mute
- Subscribe to RSS Feed
- Permalink
- Report Inappropriate Content
Hi Rocio
Not sure why that is not working for you. I'll provide some screen shots below to help you to compare your application with my working version. I have added some more data to cover more years, have removed the % of total column and have added drop down selectors to the dimensions so the pivot chart is consistent in structure to your image.
First question is whether your data model is the same as the one I have used. If not you may need to translate your data to match the structure shown below.
My sample data was from an Excel spreadsheet and was formatted as:
| Region | Gasto | Year |
| OP.Mineras | 6045 | 2011 |
| OP.Mineras | 5600 | 2012 |
| OP.Mineras | 5800 | 2013 |
| OP.Mineras | 5941 | 2014 |
| OP.Mineras | 7263 | 2015 |
| Staff | 19456 | 2011 |
| Staff | 18526 | 2012 |
| Staff | 22365 | 2013 |
| Staff | 25524 | 2014 |
| Staff | 54171 | 2015 |
| Puebla-Ver | 3865 | 2011 |
| Puebla-Ver | 5012 | 2012 |
| Puebla-Ver | 4856 | 2013 |
| Puebla-Ver | 5430 | 2014 |
| Puebla-Ver | 6033 | 2015 |
| Golfo | 4003 | 2011 |
| Golfo | 4256 | 2012 |
| Golfo | 4500 | 2013 |
| Golfo | 4630 | 2014 |
| Golfo | 6423 | 2015 |
| Centro | 2894 | 2011 |
| Centro | 3956 | 2012 |
| Centro | 3825 | 2013 |
| Centro | 4083 | 2014 |
| Centro | 3801 | 2015 |
| Agricola | 1056 | 2011 |
| Agricola | 1188 | 2012 |
| Agricola | 1203 | 2013 |
| Agricola | 1183 | 2014 |
| Agricola | 1601 | 2015 |
| Tamps. Sur | 4109 | 2011 |
| Tamps. Sur | 4325 | 2012 |
| Tamps. Sur | 4254 | 2013 |
| Tamps. Sur | 4286 | 2014 |
| Tamps. Sur | 4316 | 2015 |
Second thing to check is the dimensions and expressions:


Expressions:
Sum (Gasto)
Sum(Gasto-aggr(above(sum({<Year=>} Gasto)), Region, Year))
The result of this in my application is:
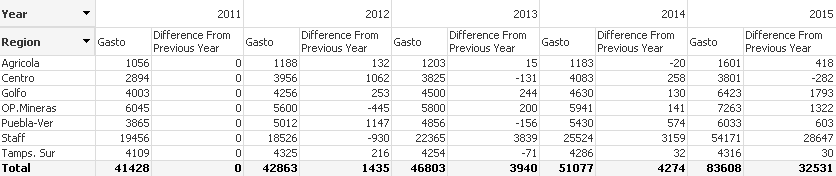
I repeated the application changing my column names to match yours and using your formula
=Sum(Gastos_MXN-Aggr(above(sum({<Año=>} Gastos_MXN)), Region, Año))
and it worked giving the same result as above so your formula is correct.
I tried a few manipulations to see if I could repeat your error but as yet I have not managed to repeat it.
Hopefully this will help you to spot the issue and resolve it.
Kind regards
Steve