Unlock a world of possibilities! Login now and discover the exclusive benefits awaiting you.
- Qlik Community
- :
- All Forums
- :
- QlikView App Dev
- :
- Re: Calculated year dimension
- Subscribe to RSS Feed
- Mark Topic as New
- Mark Topic as Read
- Float this Topic for Current User
- Bookmark
- Subscribe
- Mute
- Printer Friendly Page
- Mark as New
- Bookmark
- Subscribe
- Mute
- Subscribe to RSS Feed
- Permalink
- Report Inappropriate Content
Calculated year dimension
Hello everyone,
I want to have a year over year comparison in a bar chart. So my idea is this:
Bar 1:
current date to the same date last year (so for example 18.09.2014 - 18.09.2013)
Bar 2:
date last year to the same date 2 years ago (so for example 18.09.2013 - 18.09.2012)
etc.
Do you know what I mean?
Any idea how to realise this?
I guess that I have to use a calculated dimension...
Thanks!
Best regards,
Moritz
Accepted Solutions
- Mark as New
- Bookmark
- Subscribe
- Mute
- Subscribe to RSS Feed
- Permalink
- Report Inappropriate Content
Did it now with a Value list:
In the dimension it looks like this:
=ValueList(v1, v2, v3, v4, v5)
v1 is Today - Today-1Year
v2 is Today-1Year - Today-2Year
v3 is Today-1Year - Today-3Year
v4 is earlier than Today -3Year
v5 is Total
In the expression like this:
=pick(match(
ValueList(v1, v2, v3, v4, v5)
, v1, v2, v3, v4, v5)
,sum({<DateField= {">=18.09.2013 <=18.09.2014"}>} ValueField)
,sum({<DateField= {">=18.09.2012 <=18.09.2013"}>} ValueField)
,sum({<DateField= {">=18.09.2011 <=18.09.2012"}>} ValueField)
,sum({<DateField= {"<=18.09.2011"}>} ValueField)
,sum(ValueField)
)
May help someone else 
Best regards,
Moritz
- Mark as New
- Bookmark
- Subscribe
- Mute
- Subscribe to RSS Feed
- Permalink
- Report Inappropriate Content
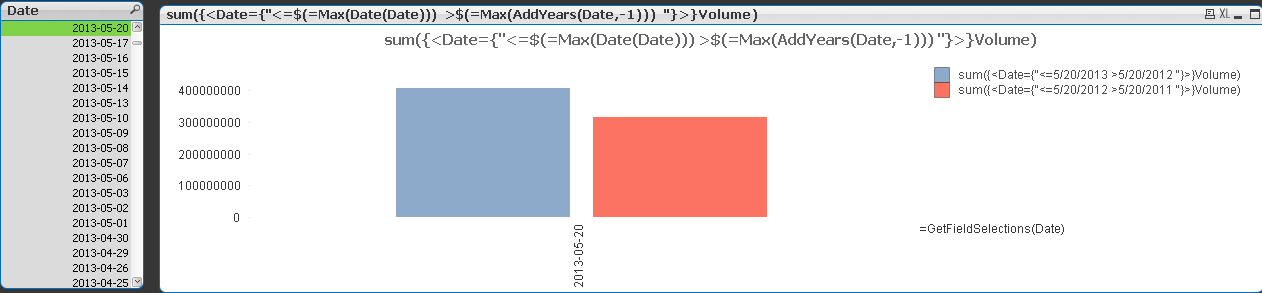
Dimension:
=GetFieldSelections(Date)
Expressions:
Bar1: sum({<Date={"<=$(=Max(Date(Date))) >$(=Max(AddYears(Date,-1))) "}>}Volume)
Bar2: sum({<Date={"<=$(=Max(AddYears(Date,-1))) >$(=Max(AddYears(Date,-2))) "}>}Volume)
- Mark as New
- Bookmark
- Subscribe
- Mute
- Subscribe to RSS Feed
- Permalink
- Report Inappropriate Content
Did it now with a Value list:
In the dimension it looks like this:
=ValueList(v1, v2, v3, v4, v5)
v1 is Today - Today-1Year
v2 is Today-1Year - Today-2Year
v3 is Today-1Year - Today-3Year
v4 is earlier than Today -3Year
v5 is Total
In the expression like this:
=pick(match(
ValueList(v1, v2, v3, v4, v5)
, v1, v2, v3, v4, v5)
,sum({<DateField= {">=18.09.2013 <=18.09.2014"}>} ValueField)
,sum({<DateField= {">=18.09.2012 <=18.09.2013"}>} ValueField)
,sum({<DateField= {">=18.09.2011 <=18.09.2012"}>} ValueField)
,sum({<DateField= {"<=18.09.2011"}>} ValueField)
,sum(ValueField)
)
May help someone else
Best regards,
Moritz