Unlock a world of possibilities! Login now and discover the exclusive benefits awaiting you.
- Qlik Community
- :
- All Forums
- :
- QlikView App Dev
- :
- Re: Cannot create grouped bar chart
- Subscribe to RSS Feed
- Mark Topic as New
- Mark Topic as Read
- Float this Topic for Current User
- Bookmark
- Subscribe
- Mute
- Printer Friendly Page
- Mark as New
- Bookmark
- Subscribe
- Mute
- Subscribe to RSS Feed
- Permalink
- Report Inappropriate Content
Cannot create grouped bar chart
I'm trying to create a grouped bar chart. I have the following sample data:
LOAD * INLINE [
Country, Sales, Costs
USA, 1000, 800
UK, 800, 700
Germany, 900, 1000
Japan, 600, 400
];
I have set the style for the chart to be grouped, but it always shows stacked. Screenshot of actual table and settings
in the properties.
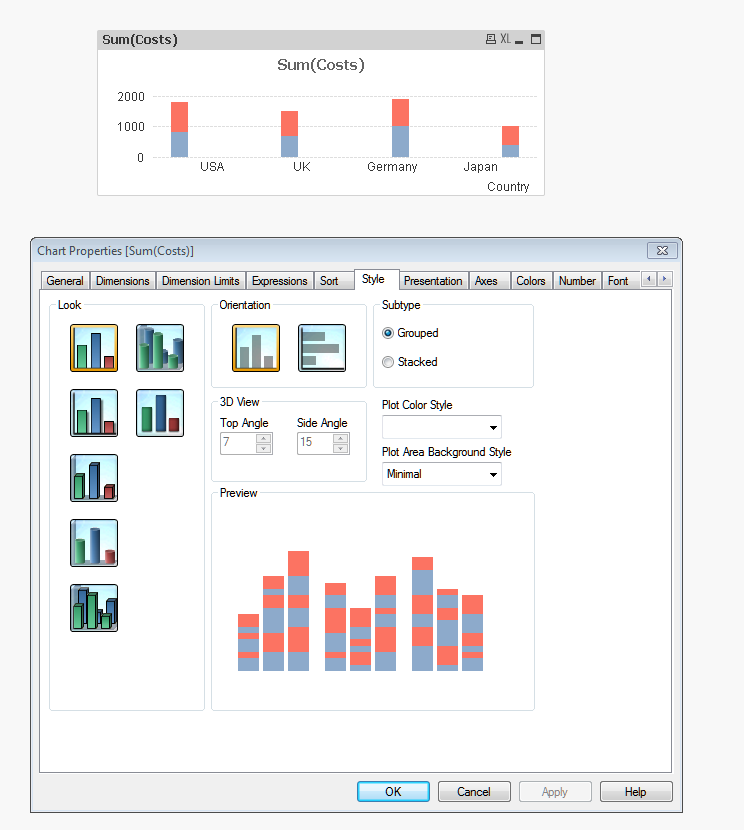
What am I missing? I am running 11.2 r5 on Windows 7. My forehead style is flat.
- « Previous Replies
-
- 1
- 2
- Next Replies »
Accepted Solutions
- Mark as New
- Bookmark
- Subscribe
- Mute
- Subscribe to RSS Feed
- Permalink
- Report Inappropriate Content
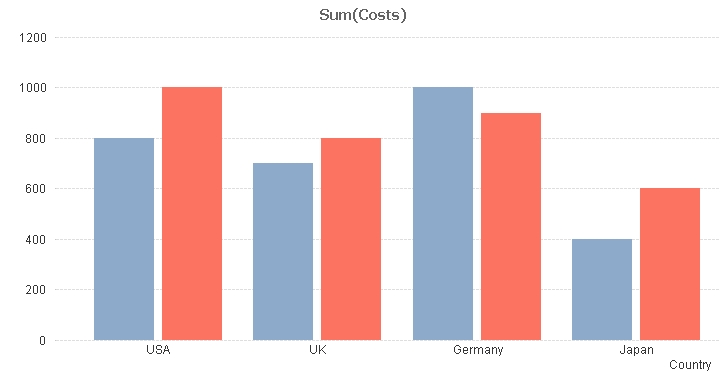
try to remove from dimensions tab
costs
sales
I did it in tour qvw, this is the result
- Mark as New
- Bookmark
- Subscribe
- Mute
- Subscribe to RSS Feed
- Permalink
- Report Inappropriate Content
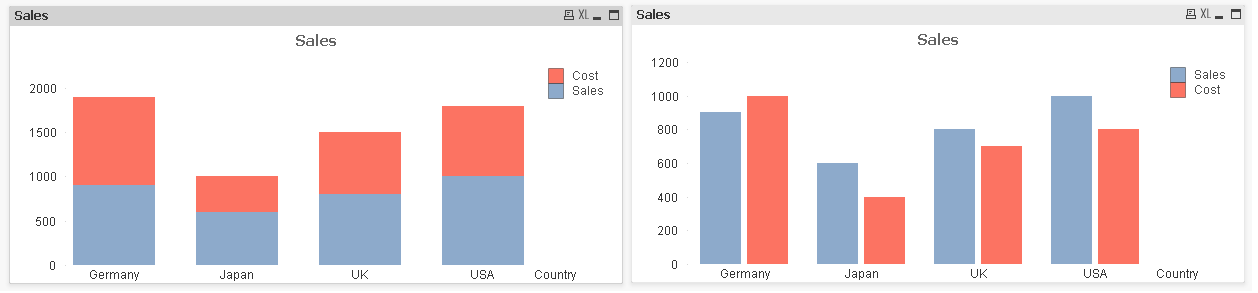
try the chart in the attachment and post your qvw if possible
- Mark as New
- Bookmark
- Subscribe
- Mute
- Subscribe to RSS Feed
- Permalink
- Report Inappropriate Content
Hi Steve.
I am also loaded the same data and its working fine for me.
Can you share your qvw file.
- Mark as New
- Bookmark
- Subscribe
- Mute
- Subscribe to RSS Feed
- Permalink
- Report Inappropriate Content
I am using the Personal Edition right now, but if you can view it, that would be great.
Thanks
- Mark as New
- Bookmark
- Subscribe
- Mute
- Subscribe to RSS Feed
- Permalink
- Report Inappropriate Content
try to remove from dimensions tab
costs
sales
I did it in tour qvw, this is the result
- Mark as New
- Bookmark
- Subscribe
- Mute
- Subscribe to RSS Feed
- Permalink
- Report Inappropriate Content
like Massimo said, you have sales and costs in your dimensions along with Country. removing the sales and costs from dimensions and leaving country alone as a dimension should take care of your issue.
- Mark as New
- Bookmark
- Subscribe
- Mute
- Subscribe to RSS Feed
- Permalink
- Report Inappropriate Content
Currentely you are using Sales in Dimension that why it showing stack chart.
use only coutry in dimension
move your sales to Expression
i mean
in dimension Country
and sales and Cost in Expression
hope this helps
- Mark as New
- Bookmark
- Subscribe
- Mute
- Subscribe to RSS Feed
- Permalink
- Report Inappropriate Content
Removing the costs and sales from the dimensions tab allowed me to change the appearance in the style tab to grouped, and the preview on the style tab then showed up as grouped, but that had no effect on the chart when the change was applied. However, creating a second chart Country as the only dimension created a grouped bar chart. Also, closing the document and reopening it caused the first chart to appear as grouped. I tried reloading the data before I closed and reopened the document, but that didn’t have any effect.
This seems like a bug to me.
Thanks to all for your very prompt help. The forum is awesome. Far superior to any other BI forum I have seen.
- Mark as New
- Bookmark
- Subscribe
- Mute
- Subscribe to RSS Feed
- Permalink
- Report Inappropriate Content
I tried the same thing,
- downloaded your doc
- removed two dimensions
and I still got the grouped bar chart without any problem
Reload, close, open, etc......always grouped
I have 11.20 SR5, perhaps a different version........?
- Mark as New
- Bookmark
- Subscribe
- Mute
- Subscribe to RSS Feed
- Permalink
- Report Inappropriate Content
I am using the Personal Edition, but I would not think that would cause the issue.
As of now, switching between grouped and stacked is now working properly. Adding the unneeded dimensions causes the
chart to switch to stacked, but removing them allows me to set it back to grouped. I can’t recreate my initial problem.
Thanks again.
- « Previous Replies
-
- 1
- 2
- Next Replies »