Unlock a world of possibilities! Login now and discover the exclusive benefits awaiting you.
- Qlik Community
- :
- All Forums
- :
- QlikView App Dev
- :
- Re: Change labels of legend
- Subscribe to RSS Feed
- Mark Topic as New
- Mark Topic as Read
- Float this Topic for Current User
- Bookmark
- Subscribe
- Mute
- Printer Friendly Page
- Mark as New
- Bookmark
- Subscribe
- Mute
- Subscribe to RSS Feed
- Permalink
- Report Inappropriate Content
Change labels of legend
Hello QlikView Community
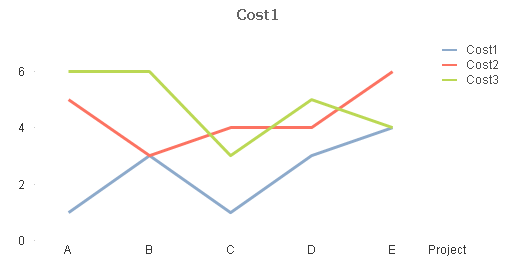
Is it possible to change the labels that are displayed at the bottom of a line chart (i.e. the legend)?
For example, if I have a chart like this, I want the A, B, C, D, E to be displayed as follows:
A should be Phase 1
B should be Phase 2
...
E should be Phase 5
I know this is possible by changing the actual data, but that is not an option for me. I want the labels to be changed only when it is displayed on the graph.
Any help or direction would be greatly appreciated.
Accepted Solutions
- Mark as New
- Bookmark
- Subscribe
- Mute
- Subscribe to RSS Feed
- Permalink
- Report Inappropriate Content
Try this as a calculated dimension instead of Project:
='Phase ' & match(Project,'A','B','C','D','E')
talk is cheap, supply exceeds demand
- Mark as New
- Bookmark
- Subscribe
- Mute
- Subscribe to RSS Feed
- Permalink
- Report Inappropriate Content
Try this as a calculated dimension instead of Project:
='Phase ' & match(Project,'A','B','C','D','E')
talk is cheap, supply exceeds demand
- Mark as New
- Bookmark
- Subscribe
- Mute
- Subscribe to RSS Feed
- Permalink
- Report Inappropriate Content
Gysbert Wassenaar, you are pure genius. Thank you thank you thank you for making my QlikView experience more enjoyable!