Unlock a world of possibilities! Login now and discover the exclusive benefits awaiting you.
- Qlik Community
- :
- All Forums
- :
- QlikView App Dev
- :
- Change y-axis in line chart by dual fields
- Subscribe to RSS Feed
- Mark Topic as New
- Mark Topic as Read
- Float this Topic for Current User
- Bookmark
- Subscribe
- Mute
- Printer Friendly Page
- Mark as New
- Bookmark
- Subscribe
- Mute
- Subscribe to RSS Feed
- Permalink
- Report Inappropriate Content
Change y-axis in line chart by dual fields
Hi all,
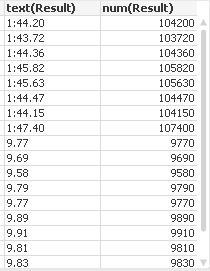
I am using a dimension stored as dual to show an athlete's result on a specific date. This Result field looks like:

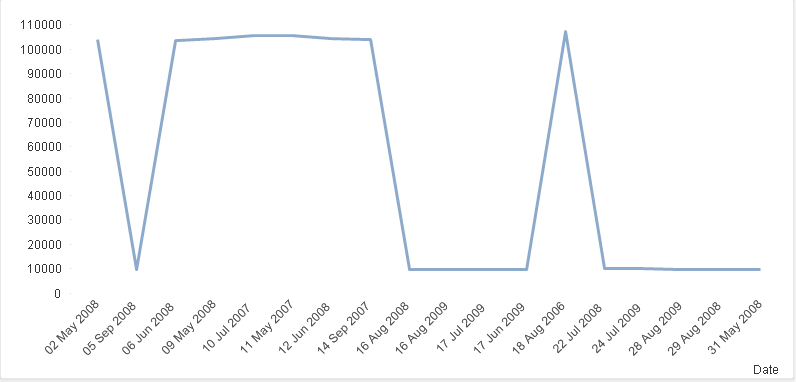
These numbers are used to make a line chart to plot an athelte's result on a specific date. This line chart shows the results with the num(Result) on the y-axis, like this:

Note: This image contains results of 2 persons. I want to be able to select 1 person, which means that the y-axis will change when selecting a person.
However, I don't want to see the num(Result) here. Instead I want to see the text(Result). I tried to adjust the number format settings in the object, but changing this to a time format is not flexibel for displaying time in ss.ff (seconds) and time in mm.ss.ff (minutes).
So my question is: How can I adjust the format on the y-axis to text(Result) and making this format flexible between time in seconds and time in minutes?
I have attached a Qlikview document as an example, where Person A's time need to be shown in minutes, and Person B's time in seconds.
Thanks in advance!
Vincent