Unlock a world of possibilities! Login now and discover the exclusive benefits awaiting you.
- Qlik Community
- :
- All Forums
- :
- QlikView App Dev
- :
- Re: Class() Data Issue
- Subscribe to RSS Feed
- Mark Topic as New
- Mark Topic as Read
- Float this Topic for Current User
- Bookmark
- Subscribe
- Mute
- Printer Friendly Page
- Mark as New
- Bookmark
- Subscribe
- Mute
- Subscribe to RSS Feed
- Permalink
- Report Inappropriate Content
Class() Data Issue
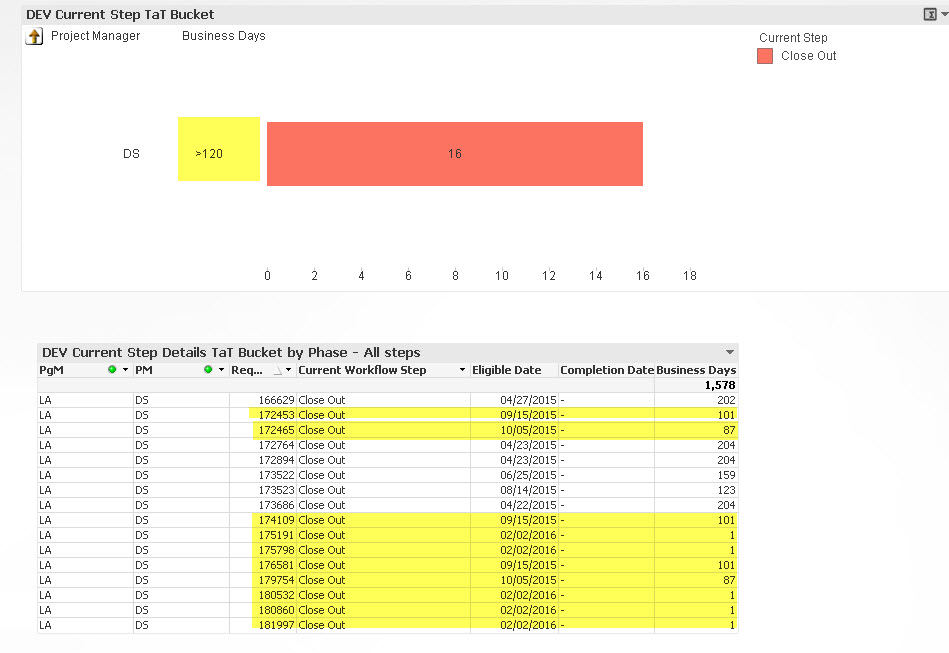
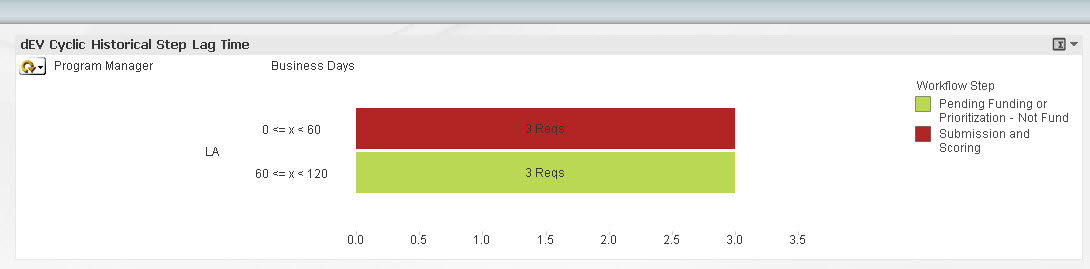
As you can see, it seems to be counting REQUEST_IDs that are not within the Business Days Turn Around Time indicated in the class.
For example, I would expect to see 16 REQUEST_IDs in Close Out for more than 120 days in the bottom table, but in reality there only appear to be 6.
How do I get both charts to reflect the correct counts?
Accepted Solutions
- Mark as New
- Bookmark
- Subscribe
- Mute
- Subscribe to RSS Feed
- Permalink
- Report Inappropriate Content
I think your two tables show different Business Days, second table uses set analysis which you need to include to first chart aggr() dimension to match
=Dual(If(Aggr(Sum({<Flag_CurrentStep={1}>}WORKFLOW_DURATION), REQUEST_ID) <= 120, Class(Aggr(Sum({<Flag_CurrentStep={1}>}WORKFLOW_DURATION), REQUEST_ID), 60), '>120'),
If(Aggr(Sum({<Flag_CurrentStep={1}>}WORKFLOW_DURATION), REQUEST_ID) <= 120, Class(Aggr(Sum({<Flag_CurrentStep={1}>}WORKFLOW_DURATION), REQUEST_ID), 60), 120))
edit:
Or alternatively adapt the second chart's expression to match count of the first chart, i.e. remove the set expression.
- Mark as New
- Bookmark
- Subscribe
- Mute
- Subscribe to RSS Feed
- Permalink
- Report Inappropriate Content
What would I do without you, Stefan? Thank you!
- Mark as New
- Bookmark
- Subscribe
- Mute
- Subscribe to RSS Feed
- Permalink
- Report Inappropriate Content
Follow up question for you... when I use this expression in a list box, selecting >120 makes the other options disappear. It worked fine with the old expression. Any idea how to overcome this?
- Mark as New
- Bookmark
- Subscribe
- Mute
- Subscribe to RSS Feed
- Permalink
- Report Inappropriate Content
Try this (Note the 1s in red)
=Dual(If(Aggr(Sum({1<Flag_CurrentStep={1}>}WORKFLOW_DURATION), REQUEST_ID) <= 120, Class(Aggr(Sum({1<Flag_CurrentStep={1}>}WORKFLOW_DURATION), REQUEST_ID), 60), '>120'),
If(Aggr(Sum({1<Flag_CurrentStep={1}>}WORKFLOW_DURATION), REQUEST_ID) <= 120, Class(Aggr(Sum({1<Flag_CurrentStep={1}>}WORKFLOW_DURATION), REQUEST_ID), 60), 120))
- Mark as New
- Bookmark
- Subscribe
- Mute
- Subscribe to RSS Feed
- Permalink
- Report Inappropriate Content
Thanks!
- Mark as New
- Bookmark
- Subscribe
- Mute
- Subscribe to RSS Feed
- Permalink
- Report Inappropriate Content
No problem 
- Mark as New
- Bookmark
- Subscribe
- Mute
- Subscribe to RSS Feed
- Permalink
- Report Inappropriate Content
Ok, so here is the follow-up... we noticed that now the List Box value does not stay green if other list box filters are also selected.
It shows green when it's the only filter but if this and something else is selected, we get this:
- Mark as New
- Bookmark
- Subscribe
- Mute
- Subscribe to RSS Feed
- Permalink
- Report Inappropriate Content
Ok, so here are the questions of the day related to this change:
I am now looking at a Historical WorkFlow Step instead of the Current Workflow Step.
If I use this expression, the chart is adding the different step days together and producing a chart that is incorrect:
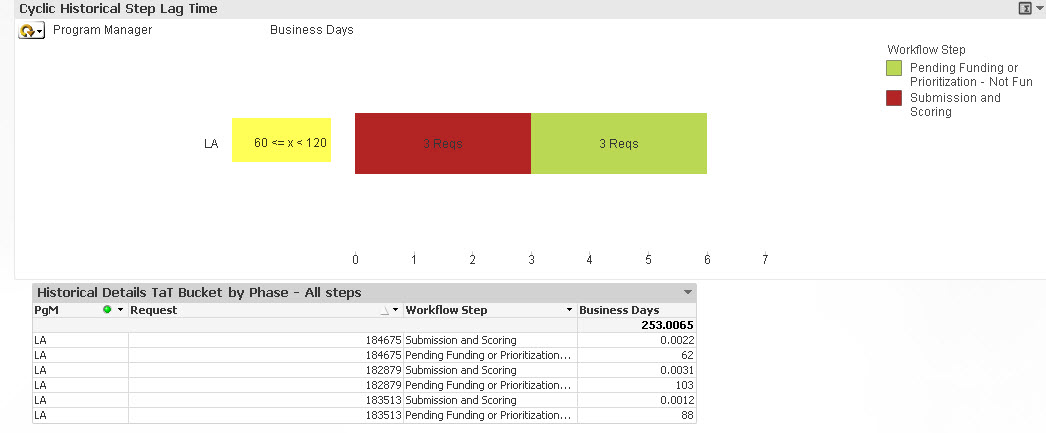
=Dual(If(Aggr(Sum({1<Flag_CurrentStep={1}>}WORKFLOW_DURATION), REQUEST_ID) <= 120, Class(Aggr(Sum({1<Flag_CurrentStep={1}>}WORKFLOW_DURATION), REQUEST_ID), 60), '>120'),
If(Aggr(Sum({1<Flag_CurrentStep={1}>}WORKFLOW_DURATION), REQUEST_ID) <= 120, Class(Aggr(Sum({1<Flag_CurrentStep={1}>}WORKFLOW_DURATION), REQUEST_ID), 60), 120))
What I would expect here is this view:
=Dual( If(WORKFLOW_DURATION <= 120, Class(WORKFLOW_DURATION, 60), '>120'), If(WORKFLOW_DURATION <= 120, Class(WORKFLOW_DURATION, 60), 120) )
Not sure if it makes sense to use these two different expressions - but one for Current Workflow Step charts (previous in thread) and one for Historical view (this one).
Also, we noticed that now the List Box value does not stay green if other list box filters are also selected.
It shows green when it's the only filter but if this and something else is selected, we get this:

I believe it's not staying green because I am using the expression with the aggr and flag:
=Dual(If(Aggr(Sum({1<Flag_CurrentStep={1}>}WORKFLOW_DURATION), REQUEST_ID) <= 120, Class(Aggr(Sum({1<Flag_CurrentStep={1}>}WORKFLOW_DURATION), REQUEST_ID), 60), '>120'),
If(Aggr(Sum({1<Flag_CurrentStep={1}>}WORKFLOW_DURATION), REQUEST_ID) <= 120, Class(Aggr(Sum({1<Flag_CurrentStep={1}>}WORKFLOW_DURATION), REQUEST_ID), 60), 120))

How can I get this expression list box to work in both scenarios for current and historical views?
Thanks!