Unlock a world of possibilities! Login now and discover the exclusive benefits awaiting you.
- Qlik Community
- :
- All Forums
- :
- QlikView App Dev
- :
- Combined graph , month and year as dimensions, two...
Options
- Subscribe to RSS Feed
- Mark Topic as New
- Mark Topic as Read
- Float this Topic for Current User
- Bookmark
- Subscribe
- Mute
- Printer Friendly Page
Turn on suggestions
Auto-suggest helps you quickly narrow down your search results by suggesting possible matches as you type.
Showing results for
Contributor
2013-01-31
03:17 AM
- Mark as New
- Bookmark
- Subscribe
- Mute
- Subscribe to RSS Feed
- Permalink
- Report Inappropriate Content
Combined graph , month and year as dimensions, two different expressions
Hi everyone,
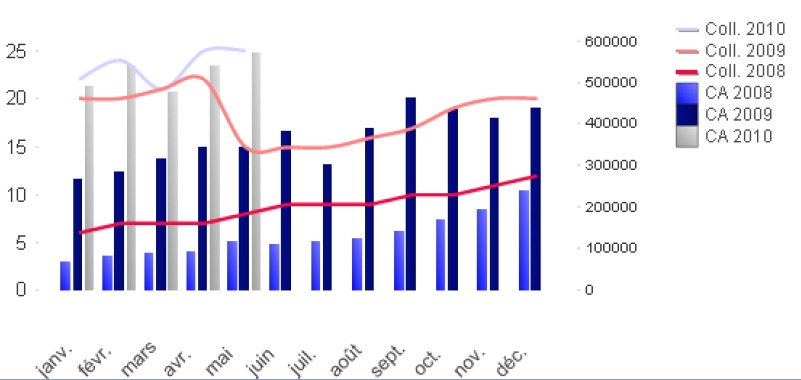
I'm searching for the way to create a combined graph line composed with month and year as dimensions.
In fact, i'd like to make a comparison of the staff with the payroll from January to December , each line representing a year.
Actually, i can get what i want but only with one expression. If i add another expression , i get what you can see in the attachments (what_i_get.jpg).
To make simple , i'll attach a picture of what i would like (what_i_want.jpg).
Regards,
Guillaume
598 Views
1 Reply
Anonymous
Not applicable
2013-01-31
04:17 AM
- Mark as New
- Bookmark
- Subscribe
- Mute
- Subscribe to RSS Feed
- Permalink
- Report Inappropriate Content
Hi Guillaume
Could you please upload a sample data file for this?
This will help us to help you quicker!
Regards
MultiView
278 Views