Unlock a world of possibilities! Login now and discover the exclusive benefits awaiting you.
- Qlik Community
- :
- All Forums
- :
- QlikView App Dev
- :
- Re: Combo Chart- Line Expression attaching to only...
- Subscribe to RSS Feed
- Mark Topic as New
- Mark Topic as Read
- Float this Topic for Current User
- Bookmark
- Subscribe
- Mute
- Printer Friendly Page
- Mark as New
- Bookmark
- Subscribe
- Mute
- Subscribe to RSS Feed
- Permalink
- Report Inappropriate Content
Combo Chart- Line Expression attaching to only one dimension
So, I have two dimensions Month and Customer and three expressions, Actual Sales, Open Sales, Planned Sales.
I am trying to create a combination chart where I want to show Actual + Open as stacked bar, compared to Planned Sales line chart, for each customer for each month.
I am able to successfully do this in Excel, file attached. But in Qlikview, the line chart is coming only for the dimension having higher priority (in this case month).
Attaching the Excel and Qlikview file for reference.
- Mark as New
- Bookmark
- Subscribe
- Mute
- Subscribe to RSS Feed
- Permalink
- Report Inappropriate Content
As far as I know the only thing you can do is combine the two dimensions into one. See attached example.
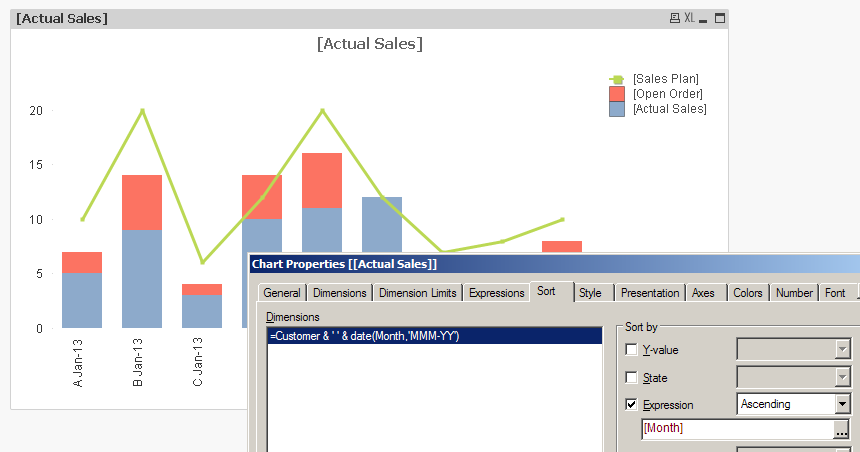
edit: Replace your two dimensions with the dimension in the below image and sort that dimension by expression [Month]
talk is cheap, supply exceeds demand
- Mark as New
- Bookmark
- Subscribe
- Mute
- Subscribe to RSS Feed
- Permalink
- Report Inappropriate Content
I am sorry, I cannot open the qvw file given the personal edition. Can you please explain in bit more detail on the steps I should follow. Thanks a ton in advance.
- Mark as New
- Bookmark
- Subscribe
- Mute
- Subscribe to RSS Feed
- Permalink
- Report Inappropriate Content
Thank you Gysbert. This works beautifully.
It would be great if you can just tell me a way to Customize the x-axis labels while keeping the chart exactly same..for ex. I want to show Jun-13 instead of A-Jun-13, because my customer names are really large and they can be seen by doing a mouse over on the bar.