Unlock a world of possibilities! Login now and discover the exclusive benefits awaiting you.
- Qlik Community
- :
- All Forums
- :
- QlikView App Dev
- :
- Conditional color based on % to Total
Options
- Subscribe to RSS Feed
- Mark Topic as New
- Mark Topic as Read
- Float this Topic for Current User
- Bookmark
- Subscribe
- Mute
- Printer Friendly Page
Turn on suggestions
Auto-suggest helps you quickly narrow down your search results by suggesting possible matches as you type.
Showing results for
Creator II
2011-06-15
12:46 PM
- Mark as New
- Bookmark
- Subscribe
- Mute
- Subscribe to RSS Feed
- Permalink
- Report Inappropriate Content
Conditional color based on % to Total
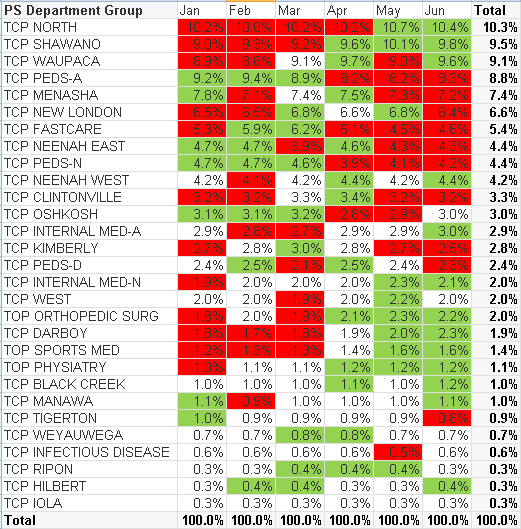
I am able to get the % to total values to display properly in my pivot table. Now, I would like to display the following background color formatting as it is in Excel. ([PS Department Group] and [KPI Month] (going across) are both dimensions.
Red where the % for individual month is less than TOTAL % for all months.
Green where the % for individual month is greater than TOTAL % for all months.

Any help is greatly appreciated!
Thanks,
Dan
- « Previous Replies
-
- 1
- 2
- Next Replies »
10 Replies
Creator II
2011-06-20
12:15 PM
Author
- Mark as New
- Bookmark
- Subscribe
- Mute
- Subscribe to RSS Feed
- Permalink
- Report Inappropriate Content
Thanks Eduardo. I was able to work out the background color expression for my issue, based on the expression you provided.![]()
174 Views
- « Previous Replies
-
- 1
- 2
- Next Replies »