Unlock a world of possibilities! Login now and discover the exclusive benefits awaiting you.
- Qlik Community
- :
- All Forums
- :
- QlikView App Dev
- :
- Consistent Colours in 3D Bar Graph
- Subscribe to RSS Feed
- Mark Topic as New
- Mark Topic as Read
- Float this Topic for Current User
- Bookmark
- Subscribe
- Mute
- Printer Friendly Page
- Mark as New
- Bookmark
- Subscribe
- Mute
- Subscribe to RSS Feed
- Permalink
- Report Inappropriate Content
Consistent Colours in 3D Bar Graph
Hi,
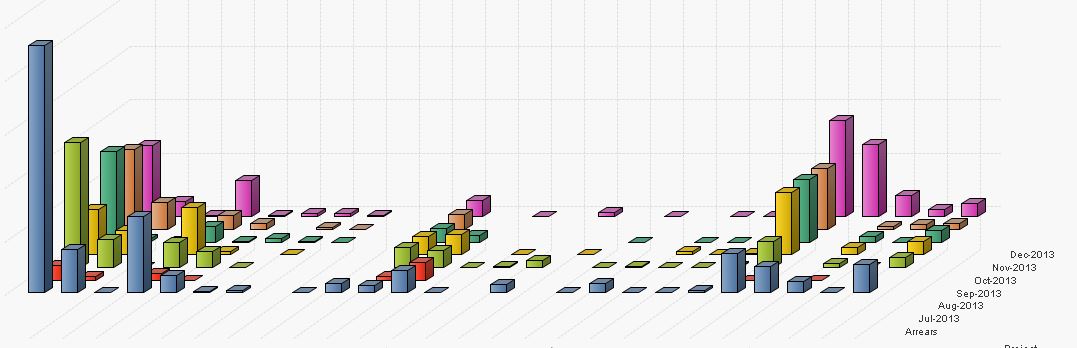
Please see the screenshot attached.
I have a 3D Graph and currently the colours are different for the dimensions on the X-Axis. I tried promoting/demoting the dimension so that the axis changes, but it completely changes the look of my graph.
Is there a way by which I can change the colours to be unique along the x-axis instead of the Month-Year axis as it is currently on the screenshot.
Hope I can find a solution.
Thanks.
Regards,
Kesh
- Mark as New
- Bookmark
- Subscribe
- Mute
- Subscribe to RSS Feed
- Permalink
- Report Inappropriate Content
Hi,
In the load script, you can define a colour that is unique to the dimension, then apply that colour to the expression (by setting the Background Color attribute to the expression RGB(R,G,B)).
See the attached qvw file for a simple example.
Thanks,
Azam
- Mark as New
- Bookmark
- Subscribe
- Mute
- Subscribe to RSS Feed
- Permalink
- Report Inappropriate Content
Hi Azam,
Thanks for the reply. I have quite a few values in that dimension. I thought there would be a way of assigning unique colours for each value.
Anyway, Thanks anyway !
Keshav