Unlock a world of possibilities! Login now and discover the exclusive benefits awaiting you.
- Qlik Community
- :
- All Forums
- :
- QlikView App Dev
- :
- Re: Count
Options
- Subscribe to RSS Feed
- Mark Topic as New
- Mark Topic as Read
- Float this Topic for Current User
- Bookmark
- Subscribe
- Mute
- Printer Friendly Page
Turn on suggestions
Auto-suggest helps you quickly narrow down your search results by suggesting possible matches as you type.
Showing results for
Not applicable
2017-10-05
10:13 PM
- Mark as New
- Bookmark
- Subscribe
- Mute
- Subscribe to RSS Feed
- Permalink
- Report Inappropriate Content
Count
Data Source For Example:
| Created Date | Resolved Date | NoOfMinutes |
|---|---|---|
| 15/08/2017 17:37 | 15/08/2017 18:09 | 32 |
| 11/08/2017 15:04 | 11/08/2017 15:41 | 37 |
| 08/08/2017 11:47 | 11/08/2017 21:20 | 573 |
| 11/08/2017 12:30 | 06/09/2017 15:15 | 37704 |
How do i count the created date in bar chart?
Conditional
<= 45 Minutes
> 45 Minutes
Count Based on Created Date and Resolved Month.
I am using alternate state so that when i click on a month it will display accordingly
The result will be like this:
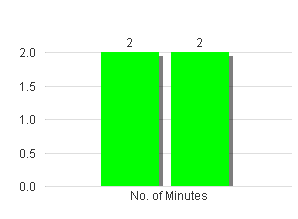
Created (August)
<= 45 Minutes = 2
> 45 Minutes = 2
Resolved (August)
<= 45 Minutes = 2
> 45 Minutes = 1
280 Views
1 Reply
Master II
2017-10-06
01:52 PM
- Mark as New
- Bookmark
- Subscribe
- Mute
- Subscribe to RSS Feed
- Permalink
- Report Inappropriate Content
see attached file
hope this helps
140 Views