Unlock a world of possibilities! Login now and discover the exclusive benefits awaiting you.
- Qlik Community
- :
- All Forums
- :
- QlikView App Dev
- :
- Cumulative in the same graph?
Options
- Subscribe to RSS Feed
- Mark Topic as New
- Mark Topic as Read
- Float this Topic for Current User
- Bookmark
- Subscribe
- Mute
- Printer Friendly Page
Turn on suggestions
Auto-suggest helps you quickly narrow down your search results by suggesting possible matches as you type.
Showing results for
Contributor
2011-12-15
04:02 AM
- Mark as New
- Bookmark
- Subscribe
- Mute
- Subscribe to RSS Feed
- Permalink
- Report Inappropriate Content
Cumulative in the same graph?
I have a graph of cumulative sales and want to represent their variation on the same graph. I can not get properly calculate the variability of the accumulated data.
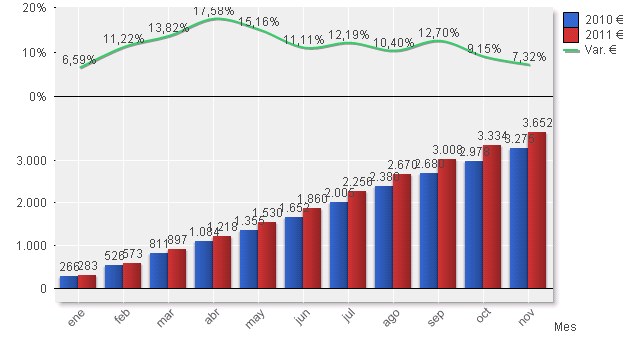
February is the incremental (573 of 526) 8.9% and 11.2% as the chart says.
Thanks.
PVM
875 Views
2 Replies
Employee
2012-01-03
12:34 PM
- Mark as New
- Bookmark
- Subscribe
- Mute
- Subscribe to RSS Feed
- Permalink
- Report Inappropriate Content
Hi,
How are the expressions you are using in the chart? Are you using the "Full Accumulation" in the Expressions tab for all the expression?
Regards,
Miguel
289 Views
Contributor
2012-01-04
08:29 AM
Author
- Mark as New
- Bookmark
- Subscribe
- Mute
- Subscribe to RSS Feed
- Permalink
- Report Inappropriate Content
Hi Miguel.
When I calculate the differential and use “Full Acumulation” Qlikview adds increased each month differenctial.
Ene: 172935 / 142886 = +21.03%
Feb: 343935 / 275313 = +24.92%
Why 50.16% ????
Thanks,
Pedro
289 Views