Unlock a world of possibilities! Login now and discover the exclusive benefits awaiting you.
- Qlik Community
- :
- All Forums
- :
- QlikView App Dev
- :
- Re: Custom Format cell variable color expression
- Subscribe to RSS Feed
- Mark Topic as New
- Mark Topic as Read
- Float this Topic for Current User
- Bookmark
- Subscribe
- Mute
- Printer Friendly Page
- Mark as New
- Bookmark
- Subscribe
- Mute
- Subscribe to RSS Feed
- Permalink
- Report Inappropriate Content
Custom Format cell variable color expression
In have to paint a line on one table depending on the dimension value. I'm trying to set a expression to do it in custom format cell. Expressions in custom format cell are linked to the dimension? Anybody can help me?
- Mark as New
- Bookmark
- Subscribe
- Mute
- Subscribe to RSS Feed
- Permalink
- Report Inappropriate Content
Not really clear what do you want to do. You could set custom cell-formats within dimensions and expressions per click on the plus-sign and insert an expression like: if(CONDITION, red(), blue()). If you want show lines or bars within a table you could choose gauge-charts or mini-charts as expressions-type. Alternatively you could create bars or lines within a cell per repeat() function.
- Marcus
- Mark as New
- Bookmark
- Subscribe
- Mute
- Subscribe to RSS Feed
- Permalink
- Report Inappropriate Content
Hi Victor!
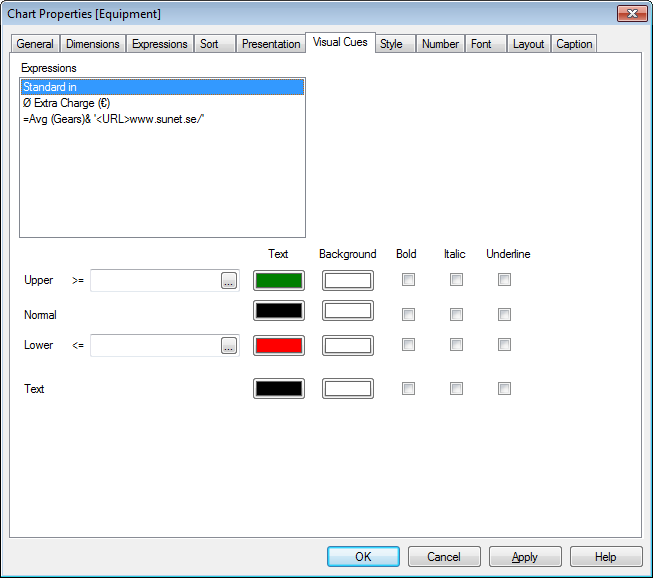
See Chart Properties: Visual Cues:
Visual cues are used for highlighting expression values and are displayed by applying a different font style,
font color and/or cell color.
Is this?
- Mark as New
- Bookmark
- Subscribe
- Mute
- Subscribe to RSS Feed
- Permalink
- Report Inappropriate Content
Hey Victor,
Can you post a sample qvw with some dummy data and maybe snap shots of your requirement if possible.
That would be helpful in addressing your questions.
Thanks
AJ
- Mark as New
- Bookmark
- Subscribe
- Mute
- Subscribe to RSS Feed
- Permalink
- Report Inappropriate Content
I'm sorry I was talking about the line between two cells in vertical in a table / pivot table. Need that line to have variable color related to a dimension value. Is that possible? That's why I'm talking about Custom Cell format. The only place in which separator line format can be changed is in that place.
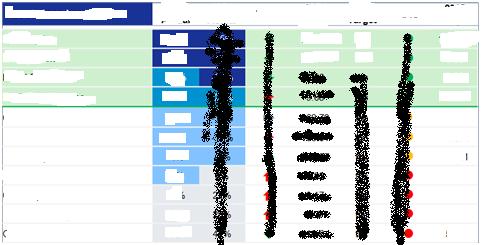
The Green line as shown in image
- Mark as New
- Bookmark
- Subscribe
- Mute
- Subscribe to RSS Feed
- Permalink
- Report Inappropriate Content
Hey Victor,
Check out the attached file and see if it helps. The coloring is based on Dimension.
- Mark as New
- Bookmark
- Subscribe
- Mute
- Subscribe to RSS Feed
- Permalink
- Report Inappropriate Content
This is correct Answer
- Mark as New
- Bookmark
- Subscribe
- Mute
- Subscribe to RSS Feed
- Permalink
- Report Inappropriate Content
I'm sorry Ajay but that's not the idea I was looking for. I want to change the "separator line" between cells. The darker green line shown in the screenshot. thanks