Unlock a world of possibilities! Login now and discover the exclusive benefits awaiting you.
- Qlik Community
- :
- All Forums
- :
- QlikView App Dev
- :
- Customized Value List
- Subscribe to RSS Feed
- Mark Topic as New
- Mark Topic as Read
- Float this Topic for Current User
- Bookmark
- Subscribe
- Mute
- Printer Friendly Page
- Mark as New
- Bookmark
- Subscribe
- Mute
- Subscribe to RSS Feed
- Permalink
- Report Inappropriate Content
Customized Value List
HI community,
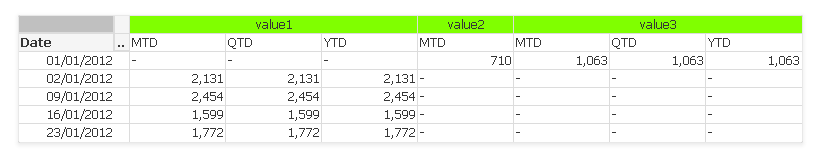
My requirement is i need to show all the MTD,QTD,YTD for both value1,value3.But for value2
only MTD should display. And the lable name should be displayed as 'Compression' instead of MTD. Please find the following attachment and kindly help me with this
Thanks in advance
Accepted Solutions
- Mark as New
- Bookmark
- Subscribe
- Mute
- Subscribe to RSS Feed
- Permalink
- Report Inappropriate Content
Try this approach by adding this to your script
Dim:
LOAD * Inline [
Dim1, Dim2
1, 1
1, 2
1, 3
2, 1
3, 1
3, 2
3, 3
];
and then use three dimensions
1) Date
2) =Pick(Dim1, 'value1', 'value2', 'value3')
3) =Pick(Dim2, 'MTD', 'QTD', 'YTD')
Expression:
Pick(Dim2,
If(Dim1 = 1, sum({$<Date = {"$(=rMTD)"}>} Sales),
If(Dim1 = 2, sum({$<Date = {"$(=rMTD)"}>} Budget),
If(Dim1 = 3, sum({$<Date = {"$(=rMTD)"}>} Forecast)))),
If(Dim1 = 1, sum({$<Date = {"$(=rQTD)"}>} Sales),
If(Dim1 = 2, sum({$<Date = {"$(=rQTD)"}>} Budget),
If(Dim1 = 3, sum({$<Date = {"$(=rQTD)"}>} Forecast)))),
If(Dim1 = 1, sum({$<Date = {"$(=rYTD)"}>} Sales),
If(Dim1 = 2, sum({$<Date = {"$(=rYTD)"}>} Budget),
If(Dim1 = 3, sum({$<Date = {"$(=rYTD)"}>} Forecast))))
)
- Mark as New
- Bookmark
- Subscribe
- Mute
- Subscribe to RSS Feed
- Permalink
- Report Inappropriate Content
sunny, thanks for your reply.its not working here.if possible could you please provide me the sample Qvw. And if you know any other work around please provide.
- Mark as New
- Bookmark
- Subscribe
- Mute
- Subscribe to RSS Feed
- Permalink
- Report Inappropriate Content
If you open this link: Re: Customized Value List, you will see that I have already attached the qvw for you to look at.
Best,
Sunny
- Mark as New
- Bookmark
- Subscribe
- Mute
- Subscribe to RSS Feed
- Permalink
- Report Inappropriate Content
Hi Sunny,
The approach that you said is fine,but i have more charts same like the one that i have given as example in those charts few charts have more columns MTD,QTD,YTD, AVG MTD, AVG QTD,AVG YTD .....etx. But i can't add that many fields in the DIM Table as its not the ideal solution. so is there any way that we can still use the value list and Hiding the unwanted.
- Mark as New
- Bookmark
- Subscribe
- Mute
- Subscribe to RSS Feed
- Permalink
- Report Inappropriate Content
I am not sure why DIM is not the ideal solution? I mean either you create dimension in script or front end, what difference does it really makes? You might be able to replicate the same using ValueList(). I can try it out in the evening.