Unlock a world of possibilities! Login now and discover the exclusive benefits awaiting you.
- Qlik Community
- :
- All Forums
- :
- QlikView App Dev
- :
- Re: Data Labels
- Subscribe to RSS Feed
- Mark Topic as New
- Mark Topic as Read
- Float this Topic for Current User
- Bookmark
- Subscribe
- Mute
- Printer Friendly Page
- Mark as New
- Bookmark
- Subscribe
- Mute
- Subscribe to RSS Feed
- Permalink
- Report Inappropriate Content
Data Labels
2 questions
1) How can you move data labels easily and quickly? A lot of times the data labels overlap, especially when numbers are larger. Only thing I've seen in forums is to write some script in the expression? So you have to go in and write that for every expression...? What if the movement of these labels doesn't solve the problems and they just run into other labels?
I feel like you should be able to drag the labels to whatever you want if this is a visualization tool so the user can place labels where he wants. Thanks for any help, it is much appreciated.
2) Can you have different number formats for the y - axis and data labels? every time I change one they both change together. Say the Y Axis is in Millions, so you have 1, 2, 3 etc..... but on the data labels you want to know the true value like 1,742,543. Is there a way to make this happen? Thank you.
- Mark as New
- Bookmark
- Subscribe
- Mute
- Subscribe to RSS Feed
- Permalink
- Report Inappropriate Content
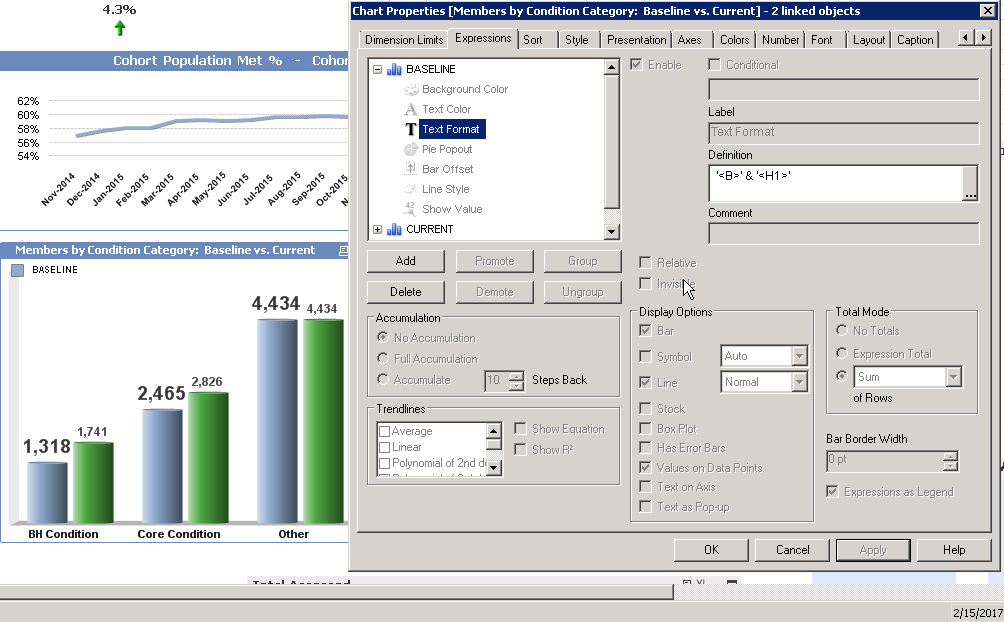
You can change the font size/Color etc for a data label but I do not believe you can change the position. This is making the label Bold and Max font size. Values for Font size are H1 to H6.
For your 2nd question, have you tried setting the axis values here(lower right corner)?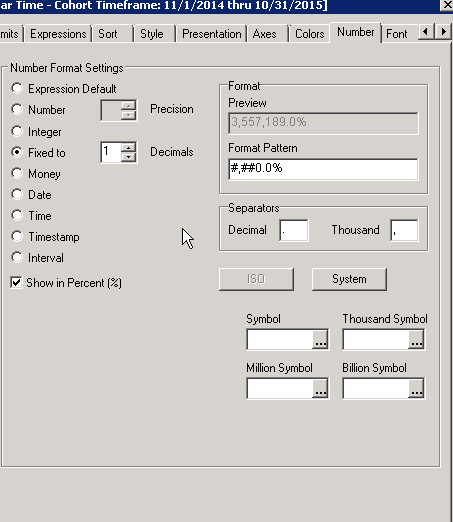
- Mark as New
- Bookmark
- Subscribe
- Mute
- Subscribe to RSS Feed
- Permalink
- Report Inappropriate Content
That seems really strange that you can't move data labels around. Isn't it common to have multiple 'lines' in line charts and Bar/Line combo charts where there are multiple data points (for example 12 month, 2 expressions is 24 labels) and they frequently overlap. My managers don't believe that you can't move data labels around so I'm trying to find a way. Is there no known way out there like excel where it is very easy to drag the labels or set some sort of function to move them? If not, is Qlikview working on this because I would assume this is a major problem for most Qlik users.
If there is no way to do this, please let me know. Thanks.
- Mark as New
- Bookmark
- Subscribe
- Mute
- Subscribe to RSS Feed
- Permalink
- Report Inappropriate Content
you can use always combination and Use both
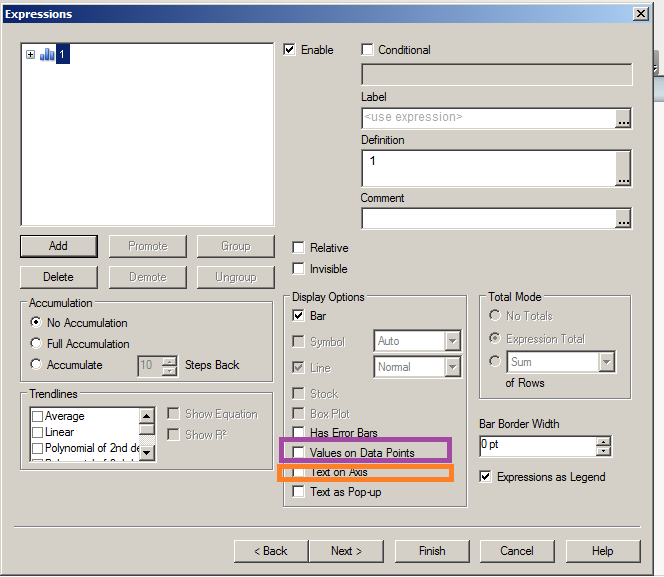
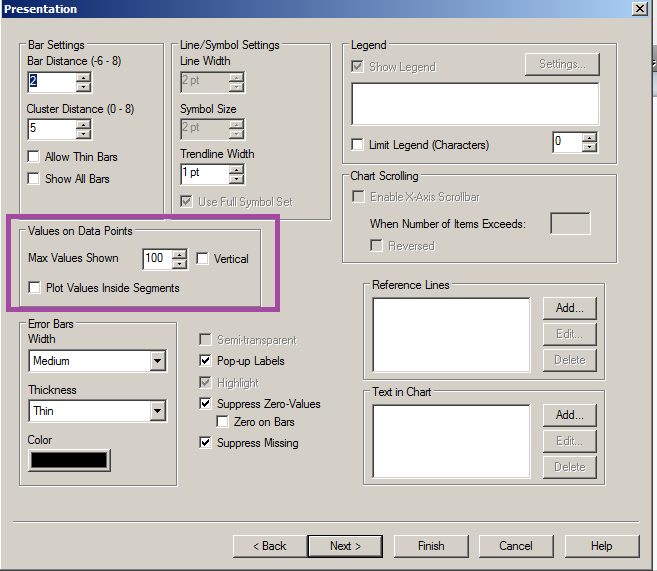
you can play around with Labes as well here
where you can move labes into the bars or make them vertical
Anna
- Mark as New
- Bookmark
- Subscribe
- Mute
- Subscribe to RSS Feed
- Permalink
- Report Inappropriate Content
Hi Anna.
Thanks for the help, and I've tried playing around with those tools. Bar charts is easier to get around by number formatting, but line charts you can't move the data labels around like you can in bar charts.
This is my problem. Is there no way to shift data label above and below the line so they don't overlap?

- Mark as New
- Bookmark
- Subscribe
- Mute
- Subscribe to RSS Feed
- Permalink
- Report Inappropriate Content
Yes, I had this problem too,
and there is no simple solution but you can:
change a font size to smaller, different them by color,
you can make one on a chart and one on a axis (is user will agree)
change the scale and do not start from zero (make it automatic or for example min-0.1
- Mark as New
- Bookmark
- Subscribe
- Mute
- Subscribe to RSS Feed
- Permalink
- Report Inappropriate Content
Has anybody figured out a solution to the data overlap problem on combo charts (i.e. bar and line charts)?