Unlock a world of possibilities! Login now and discover the exclusive benefits awaiting you.
- Qlik Community
- :
- All Forums
- :
- QlikView App Dev
- :
- Different colors according to value
- Subscribe to RSS Feed
- Mark Topic as New
- Mark Topic as Read
- Float this Topic for Current User
- Bookmark
- Subscribe
- Mute
- Printer Friendly Page
- Mark as New
- Bookmark
- Subscribe
- Mute
- Subscribe to RSS Feed
- Permalink
- Report Inappropriate Content
Different colors according to value
In the example:
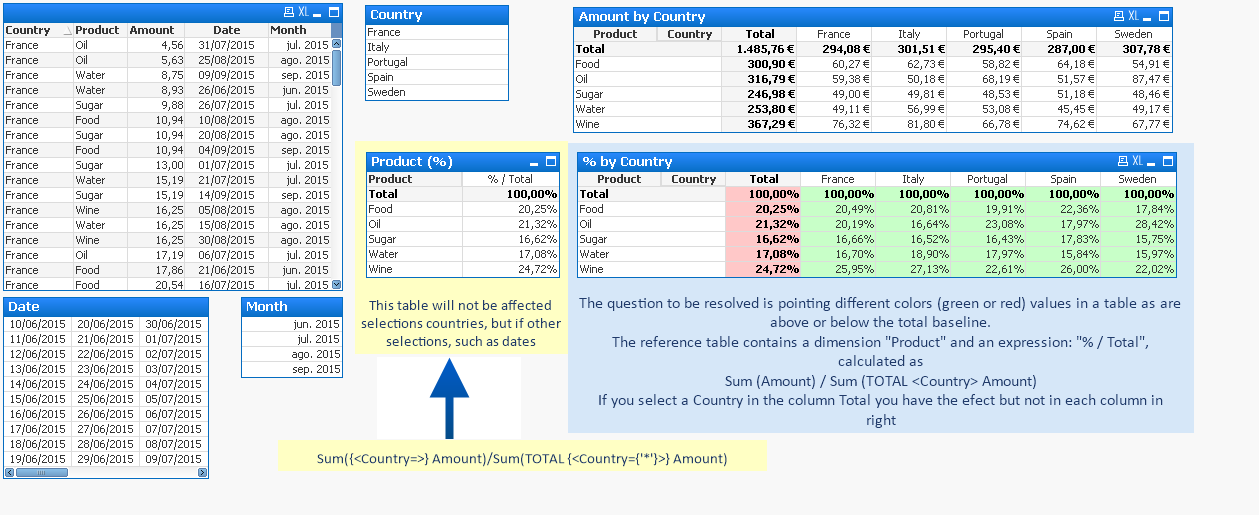
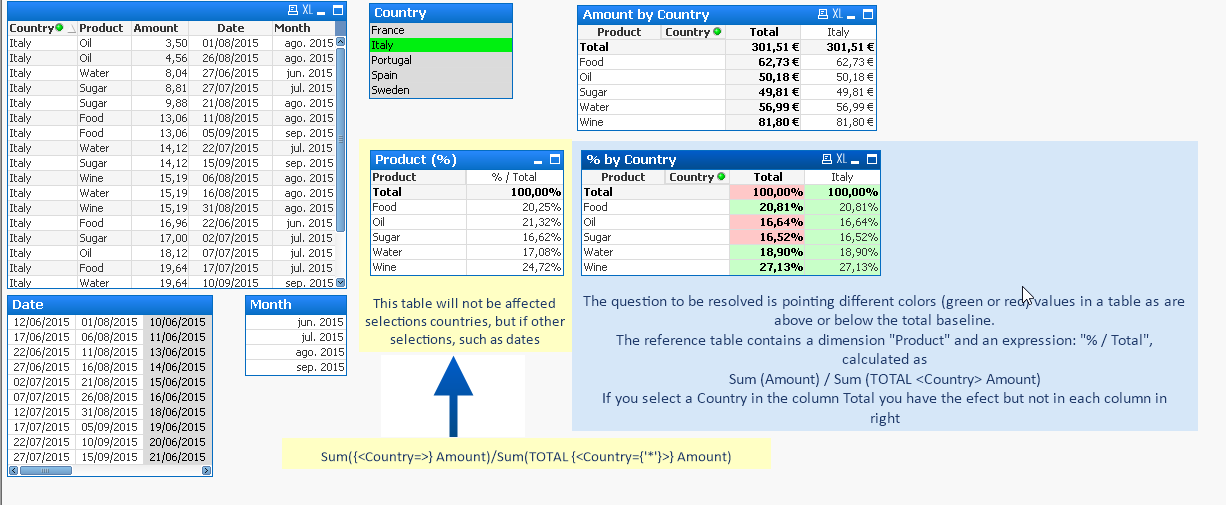
The question to be resolved is pointing different colors (green or red) values in a table as are above or below the total baseline.
The reference table contains a dimension "Product" and an expression: "% / Total", calculated as
Sum (Amount) / Sum (TOTAL <Country> Amount)
If you select a Country in the column Total you have the efect but not in each column in right
And when you select a country, the efect over total column is ok, but not over the columns
Tx
Accepted Solutions
- Mark as New
- Bookmark
- Subscribe
- Mute
- Subscribe to RSS Feed
- Permalink
- Report Inappropriate Content
Hi Enrique, try with this color expression:
if(Sum(Amount)/Sum(TOTAL <Country> Amount) >
Sum(TOTAL <Product> {<Country=>} Amount)/Sum(TOTAL {<Country={'*'}>} Amount), rgb(200,255,200), rgb(255,200,200))
Btw, when there are no countries selected, all totals are in red because the comparion in the if is equal ('='), so it's not '>' and goes to the else.
- Mark as New
- Bookmark
- Subscribe
- Mute
- Subscribe to RSS Feed
- Permalink
- Report Inappropriate Content
Reply
have a look at the attach example