Unlock a world of possibilities! Login now and discover the exclusive benefits awaiting you.
- Qlik Community
- :
- All Forums
- :
- QlikView App Dev
- :
- Re: Different relative lines in chart not linked t...
- Subscribe to RSS Feed
- Mark Topic as New
- Mark Topic as Read
- Float this Topic for Current User
- Bookmark
- Subscribe
- Mute
- Printer Friendly Page
- Mark as New
- Bookmark
- Subscribe
- Mute
- Subscribe to RSS Feed
- Permalink
- Report Inappropriate Content
Different relative lines in chart not linked to 100% maximum (must not be higher, may be lower)
Dear all,
I need to create a chart containing th following:
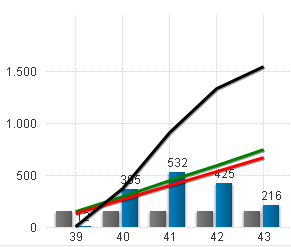
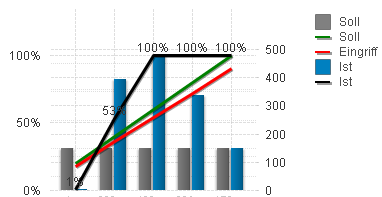
- - should-be-value / week (grey bars)
- - is-value / week (blue bars)
- - accumulated is (black line)
- - accumulated should optimum (green line)
- - accumulated should-minimum (=80% of optimum) (red line)
Finally looking similar to this:
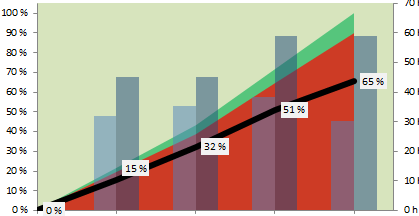
But with a subtile difference, I did not manage to create in QV:
- I need the 3 accumulations in %
- The Green shall sum up to 100% (at the last week)
- The Red shall sum up to 90%
- The black (Is-value) shall never be more than 100%, but does not need to arrive at 100% ( with "normal" relative sel. this seems not to be possible?
When I put all 3 curves to the right axis and put "relative", all 3 end up at 100% though having really different end values…
Finally it should look like similar to this:
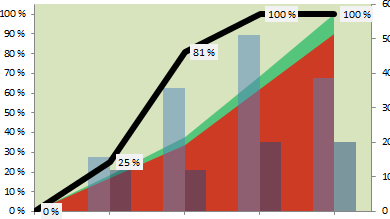
Anyone can help?
Thanks for any help!!
Oliver
Accepted Solutions
- Mark as New
- Bookmark
- Subscribe
- Mute
- Subscribe to RSS Feed
- Permalink
- Report Inappropriate Content
It's not easy to help you with correct expression without knowing a minimum of the underlying data model.
Does
=Sum(TOTAL Aggr( Sum([Config_Soll_LC.Soll-Wert]*vAnzahl_SollPF), %IWeek))
give you the correct total value for the 'Soll' line? If yes, just divide your above accumulated values by that Sum( Aggr()) expression.
Besides that, I personally wouldn't limit the 'Ist' line to 100%, since IMHO, it should show the 'Ist' performance.
If the workers do more than required, that should be visible. But that's up to you or your requirements, of course.
- Mark as New
- Bookmark
- Subscribe
- Mute
- Subscribe to RSS Feed
- Permalink
- Report Inappropriate Content
The black (Is-value) shall never be more than 100%, but does not need to arrive at 100% ( with "normal" relative sel. this seems not to be possible?
That doesn't make sense to me. How can a relative accumulation finish at something less then 100%? You accumulate all the values, but somehow that total is not the same as the total of all the values? I don't see how that's possible in this universe.
I did not manage to create in QV:
You posted in the Qlik Sense section. Is your question about Qlik Sense or QlikView?
The expressions you seem to need are something like:
- Sum(ShouldBe)
- Sum(Is)
- RangeSum(Above(Sum(Is),0,RowNo()))/sum(Total Is)
- RangeSum(Above(Sum(Should),0,RowNo()))/sum(Total Should)
- 0.8*RangeSum(Above(Sum(Should),0,RowNo()))/sum(Total Should)
Perhaps you want expression 3 to be RangeSum(Above(Sum(Is),0,RowNo()))/sum(Total Should) instead, i.e relative to the total of Should instead of Is. Or perhaps even RangeSum(Above(Sum(Is),0,RowNo()))/RangeMax(sum(Total Should),sum(Total Is))
talk is cheap, supply exceeds demand
- Mark as New
- Bookmark
- Subscribe
- Mute
- Subscribe to RSS Feed
- Permalink
- Report Inappropriate Content
The black (Is-value) shall never be more than 100%, but does not need to arrive at 100% ( with "normal" relative sel. this seems not to be possible?
That doesn't make sense to me. How can a relative accumulation finish at something less then 100%? You accumulate all the values, but somehow that total is not the same as the total of all the values? I don't see how that's possible in this universe.
-->Reason is the contract foresees to e.g. test 50 hours / week - over e.g. 5 weeks, which makes 250 hours in total= 100%. f the contractor happens to test more hours in the first 2 weeks, fine. But we only want to see that within 5 weeks he tested 250h=100%. If he tests 5x55h, he will hit the 100% earlier and stay at 100% till the end...
I did not manage to create in QV:
You posted in the Qlik Sense section. Is your question about Qlik Sense or QlikView?
Sorry, it is about QlikView - my mistake! I probably should re-poste there...
The expressions you seem to need are something like:
- Sum(ShouldBe)
- Sum(Is)
- RangeSum(Above(Sum(Is),0,RowNo()))/sum(Total Is)
- RangeSum(Above(Sum(Should),0,RowNo()))/sum(Total Should)
- 0.8*RangeSum(Above(Sum(Should),0,RowNo()))/sum(Total Should)
Perhaps you want expression 3 to be RangeSum(Above(Sum(Is),0,RowNo()))/sum(Total Should) instead, i.e relative to the total of Should instead of Is. Or perhaps even RangeSum(Above(Sum(Is),0,RowNo()))/RangeMax(sum(Total Should),sum(Total Is))
Thanks for the suggestions, I only cannot completely follow.
- ok- works

- ok-works
- - 5
 Using the above-function lets the first week uncounted and the chart start later?
Could you maybe explain the RangeSum(Above(Sum - construct?
For 3-5 I also thought of using the Full Accumulation-option on the Expression-tab instead of summing up?
What I need is really something like
accumulated-sum-over-all-previous-weeks(Is) / final-accumulated-maximum-over-all-weeks(should) [%] - never beeing more than 1 (100%)...
Thanks a lot
Oliver
- Mark as New
- Bookmark
- Subscribe
- Mute
- Subscribe to RSS Feed
- Permalink
- Report Inappropriate Content
accumulated-sum-over-all-previous-weeks(Is) / final-accumulated-maximum-over-all-weeks(should) [%] - never beeing more than 1 (100%)
That would be something like rangesum(above(sum(Value),1,RowNo()))/sum(Total Value).
Could you maybe explain the RangeSum(Above(Sum - construct?
Long story short it calculates an accumulated sum. Open Qlikview Desktop and press F1 to open the help file. Then look up and read the entries for Rangesum, Above and RowNo.
talk is cheap, supply exceeds demand
- Mark as New
- Bookmark
- Subscribe
- Mute
- Subscribe to RSS Feed
- Permalink
- Report Inappropriate Content
Thanks a lot - this got me a lot closer to it!! It took me some time to partially understand these functions, now I am approaching the right way. This is what I have now: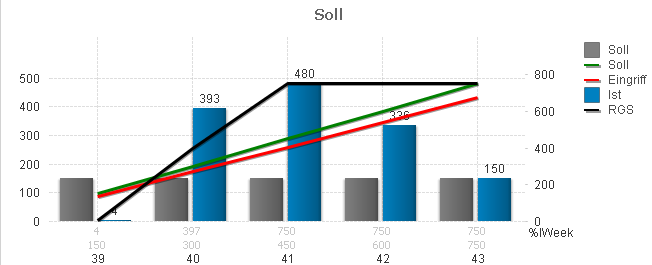
Should/Soll:
=RangeSum( Above( Sum( [Config_Soll_LC.Soll-Wert]*vAnzahl_SollPF), 0, RowNo() ) )
Is / RGS (black line):
= If( RangeSum( Above( Sum( If($(eIsWk(session.end))=[%IWeek], AW2.LC)), 0, RowNo() ) ) < 750,
RangeSum( Above( Sum( If($(eIsWk(session.end))=[%IWeek], AW2.LC)), 0, RowNo() ) ), 750 )
Basically this is what it should look like & This works "static" for me. But 2 open issues remain:
- I want to have the 3 lines "relative", and - in this case - the 750 (max of green line/should) = 100%.
- I need to have a formula for this maximum (here: 750) so that I can limit the black line.
Can you help me again with these problems please?
Thank you very much
Oliver
- Mark as New
- Bookmark
- Subscribe
- Mute
- Subscribe to RSS Feed
- Permalink
- Report Inappropriate Content
- I want to have the 3 lines "relative", and - in this case - the 750 (max of green line/should) = 100%.
So divide them by whatever value you want them to be relative to.
- I need to have a formula for this maximum (here: 750) so that I can limit the black line.
Can't help you there. I have no idea what the maximum means. Why 750? Why not 42 or 2*π ?
talk is cheap, supply exceeds demand
- Mark as New
- Bookmark
- Subscribe
- Mute
- Subscribe to RSS Feed
- Permalink
- Report Inappropriate Content
Sorry looks like I formulated my question bad...
The 750 was just a random example to check that the formula was basically working and giving me the right diagram - it is the final max value the green line is getting to on the right side of the chart.
green line =RangeSum( Above( Sum( [Config_Soll_LC.Soll-Wert]*vAnzahl_SollPF), 0, RowNo() ) )
In other diagrams the green line would go up to other values....
--> What I actually am looking for is the formula to get to the max. value the green line is getting SO THAT I can then use this formula to divide all values by this (to make it relative)
AND to us this in the "IF value < this formula then value else this formula" to get the maximum in the chart.
But I cannot use this formula
green line =RangeSum( Above( Sum( [Config_Soll_LC.Soll-Wert]*vAnzahl_SollPF), 0, RowNo() ) )
to in the other graphs as it is not constant for all week-bars but changes for each bar... and I have no idea how to get a constant maximum for the line - do you?
Thanks! Oliver
- Mark as New
- Bookmark
- Subscribe
- Mute
- Subscribe to RSS Feed
- Permalink
- Report Inappropriate Content
It's not easy to help you with correct expression without knowing a minimum of the underlying data model.
Does
=Sum(TOTAL Aggr( Sum([Config_Soll_LC.Soll-Wert]*vAnzahl_SollPF), %IWeek))
give you the correct total value for the 'Soll' line? If yes, just divide your above accumulated values by that Sum( Aggr()) expression.
Besides that, I personally wouldn't limit the 'Ist' line to 100%, since IMHO, it should show the 'Ist' performance.
If the workers do more than required, that should be visible. But that's up to you or your requirements, of course.
- Mark as New
- Bookmark
- Subscribe
- Mute
- Subscribe to RSS Feed
- Permalink
- Report Inappropriate Content
THANK you very much for your help - this works perfectly and gets me to the chart I need: 
Using these formulas
SET eMaxSoll=Sum(TOTAL Aggr( Sum( $1 * vAnzahl_SollPF), %IWeek)); //Max of "Soll"
//FOR A RELATIVE CURVE:
SET eIstKurveRel= // Parameter= TimeStamp, AW2.LC, [Config_Soll_LC.Soll-Wert]
If(
RangeSum( Above( Sum( If($(eIsWk($1))=[%IWeek], $2)), 0, RowNo() ) )/$(eMaxSoll($3)) < 1,
RangeSum( Above( Sum( If($(eIsWk($1))=[%IWeek], $2)), 0, RowNo() ) )/$(eMaxSoll($3))
,1 );
//FOR AN ABSOLUTE CURVE:
SET eIstKurveAbs= // Parameter= TimeStamp, AW2.LC, [Config_Soll_LC.Soll-Wert]
If( RangeSum( Above( Sum( If($(eIsWk($1))=[%IWeek], $2)), 0, RowNo() ) ) < $(eMaxSoll($3)),
RangeSum( Above( Sum( If($(eIsWk($1))=[%IWeek], $2)), 0, RowNo() ) )
,$(eMaxSoll($3)) );