Unlock a world of possibilities! Login now and discover the exclusive benefits awaiting you.
- Qlik Community
- :
- All Forums
- :
- QlikView App Dev
- :
- Display / determine value of most recent datapoint...
- Subscribe to RSS Feed
- Mark Topic as New
- Mark Topic as Read
- Float this Topic for Current User
- Bookmark
- Subscribe
- Mute
- Printer Friendly Page
- Mark as New
- Bookmark
- Subscribe
- Mute
- Subscribe to RSS Feed
- Permalink
- Report Inappropriate Content
Display / determine value of most recent datapoint in chart?
Hi,
I'm trying to achieve either of the following - refer the yellow highlighted text. Essentially I wish to label the last data point on a chart with its value, to avoid users having to mouseover to see the value which is difficult for mouse challenged users especially with narrow bars or line graphs to get the pointer placement.
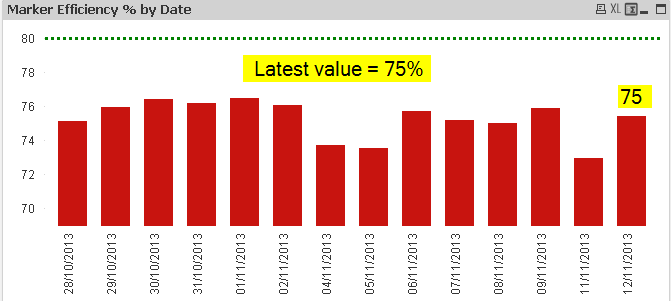
Now I know one can check the display datapoints options in the expressions. However, if one has a lot of bars the values overlap are illegible anyway. I really just want to display the latest value.
I tried adapting the code from where a method was demonstrated to plot the legend/key on the line chart itself,
Qlik Tips: Lose the Legend in Line Charts
The syntax suggested there was along the lines of
Dual( If(MonthYear=Max(total MonthYear), CategoryType, ''), Sum(Sales) )
I'm not totally clear on the fields I should be using but I assumed MonthYear above is the Date dimension field which is the X axis of the chart and Sales is the actual value (line) being plotted, so the logic is that if the MonthYear is the latest one then to display the CategoryType name next to it. In my case I'd need to replace CategoryType with the value of the latest datapoint I think.
Thus if I have a chart (as shown) and lets assume I have a X axis dimension called Dayfield and a plotted bar value for each Dayfield called [Marker Efficiency].
I can plot something on the right hand bar, but its always Null, so I think my issue more is with determining the value of the latest bar.
I then tried creating a variable, adding it in my load script after the MarkerEfficiencyTable was loaded
LET vMarkerEfficiency_latest = Peek('[Marker Efficiency]',-1,'MarkerEfficiencyTable');
I was then just going to use this value with ='Latest value =' & $(vMarkerEfficiency_latest)
to get it to display.
Once again I only get Nulls for the variable but the data clearly exists in memory somewhere because the chart plots fine.
How can I do this?
Thanks
- « Previous Replies
-
- 1
- 2
- Next Replies »
- Mark as New
- Bookmark
- Subscribe
- Mute
- Subscribe to RSS Feed
- Permalink
- Report Inappropriate Content
Try
firstsortedvalue(aggr(sum(values),-MonthYear))
- Mark as New
- Bookmark
- Subscribe
- Mute
- Subscribe to RSS Feed
- Permalink
- Report Inappropriate Content
Awesome, Nicole, that approach works a treat.
It also works with the island table so is a more universal solution. I'm guessing without me doing any RTM yet that the '?*' is a wildcard set so it displays any value at the x-axis point where it needs to find one. Whatever, it works 🙂
I tried the Monthly aggregation as
='Latest value A =' & Sum({<Month(WeekDate)={"$(=Max({<ValueA={'?*'}>}Month(WeekDate)))"}>} ValueA) & ' Latest value B =' & Sum({<Month(WeekDate)={"$(=Max({<ValueA={'?*'}>}Month(WeekDate)))"}>} ValueB)
but that doesnt work it seems.
-----------
Clever, your method looks promising too. However, if I substitute my fieldnames into the formula you suggested I get an expression error, so unless I did something wrong it looks to be missing a field from the expression syntax. I tried some combinations and on an island table (i.e. without including the common calendar script) I got this expression to work correctly. It gives the value of A on 22/11 in my test qvw.
=Firstsortedvalue(ValueA,-Aggr(sum(WeekDate),WeekDate))
However, if I try the same idea on the monthly aggregation like this it doesnt work - I just get Null.
=Firstsortedvalue(ValueA,-Aggr(sum(Month(WeekDate)),Month(WeekDate)))
I also tried
=Firstsortedvalue(Sum(ValueA),-Aggr(sum(Month(WeekDate)),Month(WeekDate)))
The expression also doesnt work (whether aggregated into months or not i.e. as weeks) when I add in a common Calendar containing a later date than which exists in my plotted data table.
----
Thus, just one last thing to figure out then, showing the last plotted value when doing monthly agrregation in the presence of a common Calendar table.
Thanks to all for your valuable input thus far,
- Mark as New
- Bookmark
- Subscribe
- Mute
- Subscribe to RSS Feed
- Permalink
- Report Inappropriate Content
Firstsorted value has an important behavior, if two or more values share the same rank, null is returned.
In this case, you should slightly change your rank expression.
Into your expressions sum(WeekDate) does not make sense to me.
Is it possible to post a sample of your data?
- Mark as New
- Bookmark
- Subscribe
- Mute
- Subscribe to RSS Feed
- Permalink
- Report Inappropriate Content
You're correct about the ?--it is a wildcard so that we only find dates where ValueA (or ValueB) exist (the length is 1 or greater).
As for this:
='Latest value A =' & Sum({<Month(WeekDate)={"$(=Max({<ValueA={'?*'}>}Month(WeekDate)))"}>} ValueA) & ' Latest value B =' & Sum({<Month(WeekDate)={"$(=Max({<ValueA={'?*'}>}Month(WeekDate)))"}>} ValueB)
It doesn't work because you cannot have a calculation on the left side of the equal sign in set analysis. You would need to create a new field in the load script where you calculate Month(WeekDate) and then use that in the set analysis.
- Mark as New
- Bookmark
- Subscribe
- Mute
- Subscribe to RSS Feed
- Permalink
- Report Inappropriate Content
Kicking this up and dusting it off, because I have been searching the forum and did not come up with a simple and robust answer. However, I found a solution that works at least for me, although it might take some creative thinking to implement in your specific situation.
The expression has some properties you can set with expressions as well:
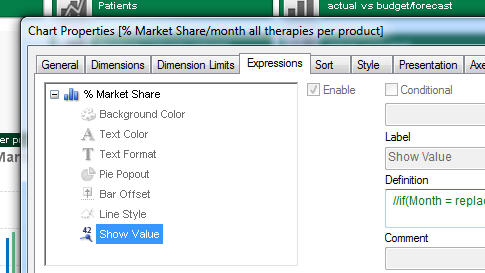
One of these is 'show value'. This can contain an expression that evaluates to either 0 (false) or 1 (true) based on the criteria you define. As I said, this involves some creative thinking on how to create a statement that will evaluate to true or false with the right conditions, but it should be possible to accomplish.
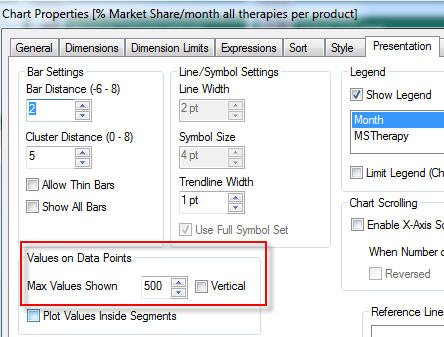
It can also be used in line charts to show values on datapoints for only some values in the dimension. 'Show value on datapoint' should be unchecked. Also mind the setting 'Max Values Shown' setting on the presentations tab. If this is too low, values will not show either 
Just hope this will save someone else the hourslong quest it has cost me to accomplish this.
Regards,
HP
- « Previous Replies
-
- 1
- 2
- Next Replies »