Unlock a world of possibilities! Login now and discover the exclusive benefits awaiting you.
- Qlik Community
- :
- All Forums
- :
- QlikView App Dev
- :
- Drilling down
- Subscribe to RSS Feed
- Mark Topic as New
- Mark Topic as Read
- Float this Topic for Current User
- Bookmark
- Subscribe
- Mute
- Printer Friendly Page
- Mark as New
- Bookmark
- Subscribe
- Mute
- Subscribe to RSS Feed
- Permalink
- Report Inappropriate Content
Drilling down
Hi all,
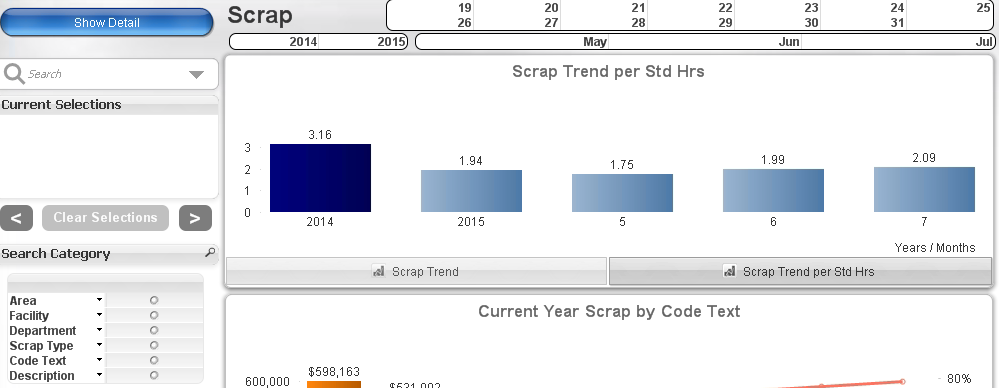
I created the above Scrap Trend per Std Hrs by using the following equation:
(sum({$<YEAR_NO={$(vCurrentYear)} >} UNIT_COST*SCRAP_QTY))
/
(sum ({$<YEAR_NO={$(vCurrentYear)} >} TOTAL_HOURS))
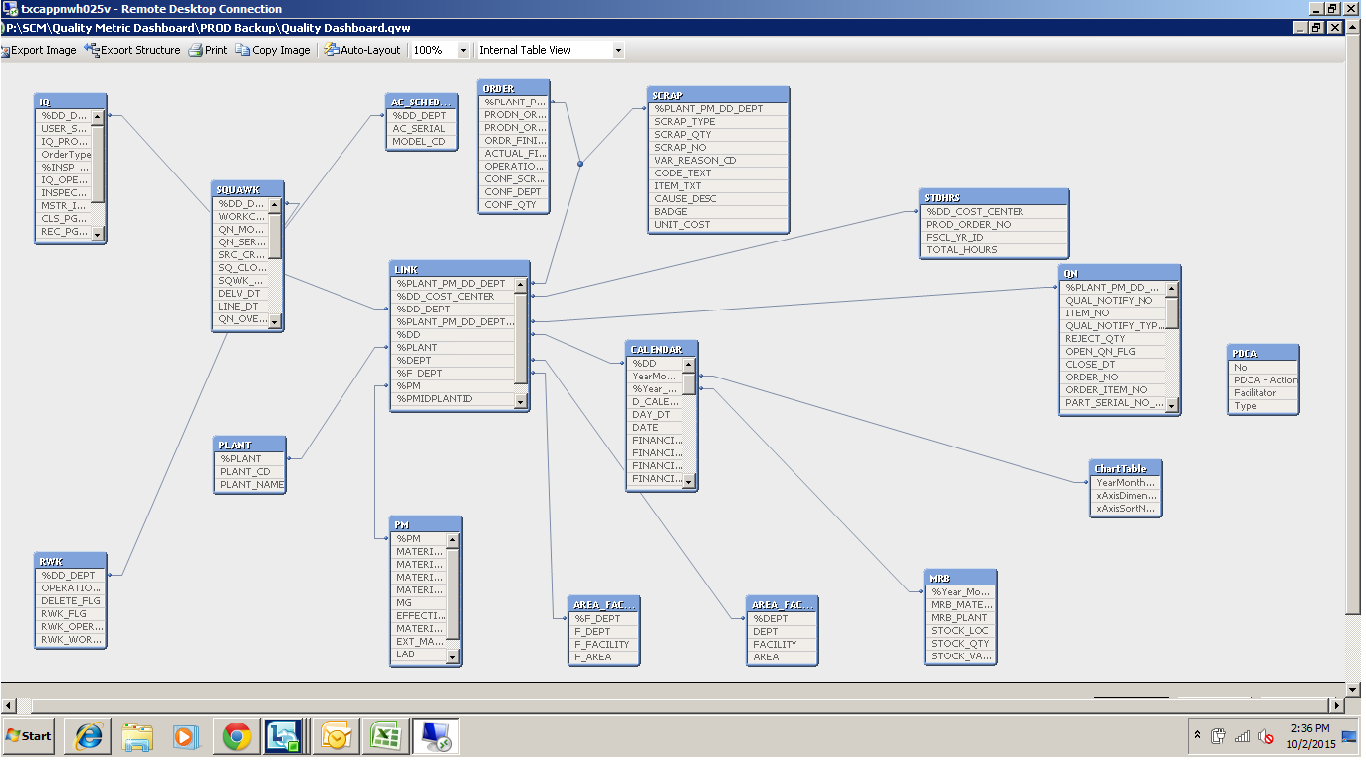
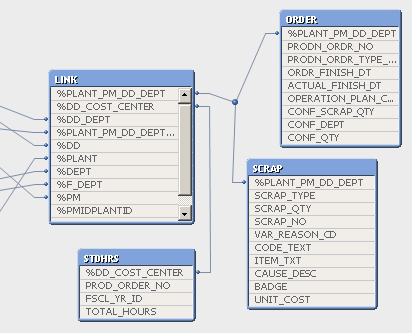
and I have a variable called vPriorYear for 2014 and did the same for that. UNIT_COST AND SCRAP_QTY come from the SCRAP table and TOTAL_HOURS comes from the STDHRS table as shown below.
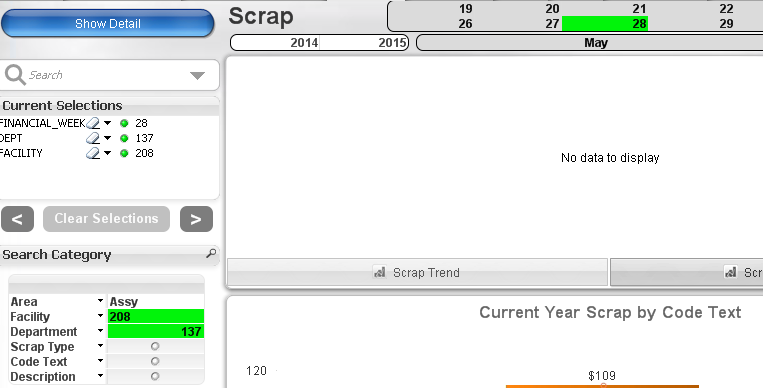
When I try to filter the data by Area, Facility, or department, the chart shows 'No data to display', as shown below. Does anyone know how to fix this?
- Mark as New
- Bookmark
- Subscribe
- Mute
- Subscribe to RSS Feed
- Permalink
- Report Inappropriate Content
could you post your qvw scrambled version if possible.
which table contains Area, Facility and Dept ? do you have associated records for the date selected?
- Mark as New
- Bookmark
- Subscribe
- Mute
- Subscribe to RSS Feed
- Permalink
- Report Inappropriate Content