Unlock a world of possibilities! Login now and discover the exclusive benefits awaiting you.
- Qlik Community
- :
- All Forums
- :
- QlikView App Dev
- :
- Dynamic Chart Display
- Subscribe to RSS Feed
- Mark Topic as New
- Mark Topic as Read
- Float this Topic for Current User
- Bookmark
- Subscribe
- Mute
- Printer Friendly Page
- Mark as New
- Bookmark
- Subscribe
- Mute
- Subscribe to RSS Feed
- Permalink
- Report Inappropriate Content
Dynamic Chart Display
Hello Everyone,
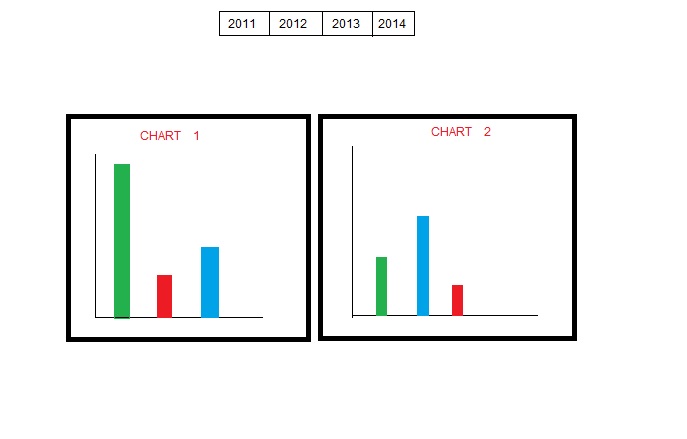
Year-List Box
On reload I have scheduled an action of selecting the max year in this case 2014.
My requirement is on reload (Year selected 2014)
Chart 1 should be 2013 Chart and Chart 2 should be 2014.
Similarly when 2013 is selected
Chart 1 should be 2012 Chart and Chart 2 should be 2013 and so on and so forth
Accepted Solutions
- Mark as New
- Bookmark
- Subscribe
- Mute
- Subscribe to RSS Feed
- Permalink
- Report Inappropriate Content
hi,
set a variable vMaxYear to the selected year from your list box. and use set analysis to get $(vMaxYear) - 1 for previous year's data in the second bar chart.
1. so Ctrl+Alt+V will bring up variables list:
2. add a variable vMaxYear and set its value to =GetFieldSelections(/*Year field*/) or max(/*Year field*/)...either one should work fine. but max() eliminates errors due to multiple year selections.
3. In the first chart, use set analysis in expression. something like sum({</*Year field*/={$(vMaxYear)}>}Sales)
4. In the second chart, use same expression as in first chart with a -1 in your set analysis...something like
sum({</*Year field*/={$(vMaxYear)-1}>}Sales)
- Mark as New
- Bookmark
- Subscribe
- Mute
- Subscribe to RSS Feed
- Permalink
- Report Inappropriate Content
Use alternate states
- Mark as New
- Bookmark
- Subscribe
- Mute
- Subscribe to RSS Feed
- Permalink
- Report Inappropriate Content
use alternate state
create two states
Set Up
Before a developer can use alternate states, at least one other state has to be created in the document. Under “Settings> Document Properties” there is a button for “Alternate States” on the “General” tab. For the example I will use later, I will create two states, “State1” and “State2”.

In standard alternate state logic, entire items can be set to react on another state. In the image captured below I have left the first list box and chart in the inherited state (the state that all objects will be assigned unless otherwise altered). After cloning both the list box and the chart, I have changed the cloned items’ state to react only to the State1 objects. Now, when a user selects items in the list box tied to State1 only the chart in State1 will filter on those values.


and then set actions for two different states
- Mark as New
- Bookmark
- Subscribe
- Mute
- Subscribe to RSS Feed
- Permalink
- Report Inappropriate Content
Hi,
Use like this for chart 1 Sum(Year = max(Year) Salvalue)
and in chart 2 Sum(Year = max(Year)-1 Salvalue)
and on Year selection chart change
Hope this helps
Thanks & Reagrds
- Mark as New
- Bookmark
- Subscribe
- Mute
- Subscribe to RSS Feed
- Permalink
- Report Inappropriate Content
hi,
set a variable vMaxYear to the selected year from your list box. and use set analysis to get $(vMaxYear) - 1 for previous year's data in the second bar chart.
1. so Ctrl+Alt+V will bring up variables list:
2. add a variable vMaxYear and set its value to =GetFieldSelections(/*Year field*/) or max(/*Year field*/)...either one should work fine. but max() eliminates errors due to multiple year selections.
3. In the first chart, use set analysis in expression. something like sum({</*Year field*/={$(vMaxYear)}>}Sales)
4. In the second chart, use same expression as in first chart with a -1 in your set analysis...something like
sum({</*Year field*/={$(vMaxYear)-1}>}Sales)
- Mark as New
- Bookmark
- Subscribe
- Mute
- Subscribe to RSS Feed
- Permalink
- Report Inappropriate Content
Like this?
- Mark as New
- Bookmark
- Subscribe
- Mute
- Subscribe to RSS Feed
- Permalink
- Report Inappropriate Content
Hi All,
Thank You for your assistance it worked fine for Year.
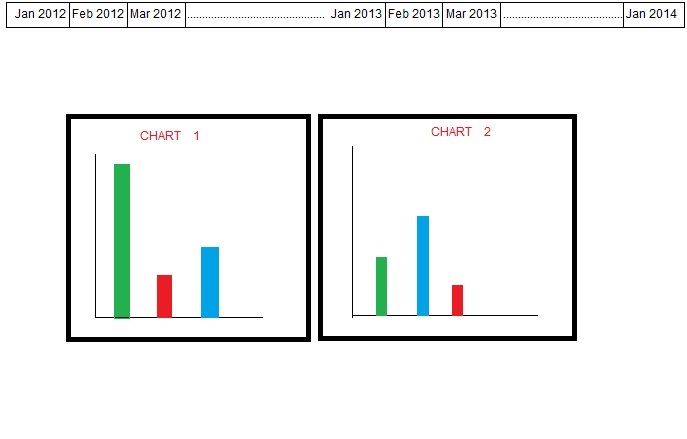
But now I have hit another road block. If the List box contents is not year instead it is Month-Year then how can we achieve the following:
On reload I have scheduled an action of selecting the max Month-year in this case Jan 2014.
My requirement is on reload (Month-Year selected Jan-2014)
Chart 1 should be Jan 2013 Chart and Chart 2 should be Jan 2014.
Similarly when Feb 2013 is selected
Chart 1 should be Feb 2012 Chart and Chart 2 should be Feb 2013 and so on and so forth
- Mark as New
- Bookmark
- Subscribe
- Mute
- Subscribe to RSS Feed
- Permalink
- Report Inappropriate Content
I could not open this document.
But anyway Thank You.
- Mark as New
- Bookmark
- Subscribe
- Mute
- Subscribe to RSS Feed
- Permalink
- Report Inappropriate Content
hi there,
a friendly suggestion - when you marked a question answered and have a new issue, best way to get faster responses is to open a new thread.
alternate states is a simple way to do this as well...advantage is that you can compare not only with last year's but you can compare with any selection. however, you actually have to select a date in each state to compare. so depending on the requirement, i would modify/use the simplest approach. the following set analysis method works for the previous year comparison only.
this should help with your new requirement. assumption is that your Jan-2014, etc. are dates.
1. create two variables:
vMaxMon=max([month-year])
vLastYearMon = date(addmonths(((vMaxMon)),-12),'MMM-YYYY')
2. Now your expressions will look like below:
Maxyear Sales = sum({1<[month-year]={"$(=vMaxMon)"}>}Sales)
LastYear's Sales = sum({1<[month-year]={"$(=vLastYearMon)"}>}Sales)