Unlock a world of possibilities! Login now and discover the exclusive benefits awaiting you.
- Qlik Community
- :
- All Forums
- :
- QlikView App Dev
- :
- Dynamic Gauge Segments
- Subscribe to RSS Feed
- Mark Topic as New
- Mark Topic as Read
- Float this Topic for Current User
- Bookmark
- Subscribe
- Mute
- Printer Friendly Page
- Mark as New
- Bookmark
- Subscribe
- Mute
- Subscribe to RSS Feed
- Permalink
- Report Inappropriate Content
Dynamic Gauge Segments
I have bee trying to assign dynamic Gauge Segments in a Table expression. I got a few Indicators and unfortunately they have different RAG rating points.
For Example KPI - 1 RAG rating points are 0%-79%=RED, 80%-89%=AMBER, 90%-100%=GREEN
KPI - 1 RAG rating points are 0%-96%=RED, 97%-99%=AMBER, 100%=GREEN
It has trhe following table structure. Target table has all the necessary RAG point data for each Indicator (KPI)
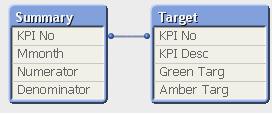
Oroginally I though just assigning the [Amber Targ] and the [Green Targ] to each segment in the Gauge will atomatically get the relevent numbers based on each indicator and the Indicator number and the Indicator Description are the dimentions in the table. BUt I was getting all green Gauge without any segments.
Then I used the follwing script for each segment
REG - Segment 1 = 0
AMBER - Segement 2 = Aggr([Amber Targ], [KPI No], [KPI Desc])
GREEN = Segment 3 = Aggr([Green Targ], [KPI No], [KPI Desc])
Still I am getting just green Gauge without any segments.
Any help will be much appreciated. I have attache the test file if you want to have a look and feel free to edit if necessary
- Mark as New
- Bookmark
- Subscribe
- Mute
- Subscribe to RSS Feed
- Permalink
- Report Inappropriate Content
Hi Sampath,
Use a Button and give the expressions
Aggr([Amber Targ], [KPI No], [KPI Desc])
and
Aggr([Green Targ], [KPI No], [KPI Desc])
Then see what they evaluate to, the result will get displayed on the button. Also if you hardcode the values for segments, it must show you what you are expecting. So you can test both ways and see whats failing.
thanks,
Rajesh Vaswani
- Mark as New
- Bookmark
- Subscribe
- Mute
- Subscribe to RSS Feed
- Permalink
- Report Inappropriate Content
Hi.
Unfortunately, it seems that for mini gauges QV calculates segment bound once for all rows.
Even if you use aggr() it just gets 0 for lower bound (thats why the last green segment is shown).
Also note, you have checked 'Logarithmic scale'.
- Mark as New
- Bookmark
- Subscribe
- Mute
- Subscribe to RSS Feed
- Permalink
- Report Inappropriate Content
Unfortunately Aleksandr seems to be correct, coloring the traffic light works when the boundaries are set manually (using a fixed value), but calculating them for each line of the table doesn't do the trick.