Unlock a world of possibilities! Login now and discover the exclusive benefits awaiting you.
- Qlik Community
- :
- All Forums
- :
- QlikView App Dev
- :
- Expression Filtration Issue
- Subscribe to RSS Feed
- Mark Topic as New
- Mark Topic as Read
- Float this Topic for Current User
- Bookmark
- Subscribe
- Mute
- Printer Friendly Page
- Mark as New
- Bookmark
- Subscribe
- Mute
- Subscribe to RSS Feed
- Permalink
- Report Inappropriate Content
Expression Filtration Issue
Goal - The chart is to only display rows where expression value is not equal to x.
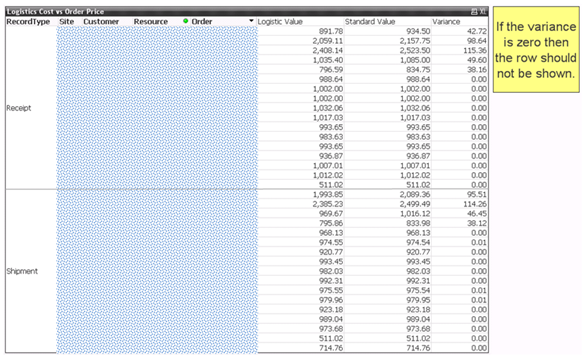
Suppress Zero - I wrapped all the equations within expression boxes in the chart to say, if x = 0 then display 0, or else do existing equation. This worked but it is not healthy looking. It is a bit of a hack so I dropped it!
Code Behind - I know I can achieve the goal if I do the equation in the code behind and quite tidily too but I wish it could be easier than this, for example, a click of a button or writing a code into a separate expression field in the chart with a command to not display the line.
Is there away around it other than those stated above?
Is this a limit of Qlikview I am encountering?
Thanks,
Andrew.
- Mark as New
- Bookmark
- Subscribe
- Mute
- Subscribe to RSS Feed
- Permalink
- Report Inappropriate Content
Hi Andrew,
You can use the expression1 Logistic Value= If(Sum(Logistic Value)<>Sum(Standard Value),Sum(Logistic Value)
Expression2: If(Sum(Logistic Value)<>Sum(Standard Value),Sum(Standard Value)
Expressio3 = Column1-column2
- Mark as New
- Bookmark
- Subscribe
- Mute
- Subscribe to RSS Feed
- Permalink
- Report Inappropriate Content
Hi,
Use the following expression
Logistic Value =If([VarianceExpressionName] = 0, 0, LogisticValueExpression) //If variance is 0 then 0
Standard Value = If([VarianceExpressionName] = 0, 0, StandardValueExpression) //If variance is 0 then 0
VarianceExpression = VarianceExpression
If all the expressions in straight/pivot table returns 0 then the row would be automatically removed by qlikview.
Regards,
Jagan.