Unlock a world of possibilities! Login now and discover the exclusive benefits awaiting you.
- Qlik Community
- :
- All Forums
- :
- QlikView App Dev
- :
- Re: Expression as a dimension
- Subscribe to RSS Feed
- Mark Topic as New
- Mark Topic as Read
- Float this Topic for Current User
- Bookmark
- Subscribe
- Mute
- Printer Friendly Page
- Mark as New
- Bookmark
- Subscribe
- Mute
- Subscribe to RSS Feed
- Permalink
- Report Inappropriate Content
Expression as a dimension
Hi
I would like to have a bar chart with document type (Invoices, Orders, Quotations) as a dimension and the Rand values as an expression. The client also want to see the sum(budget) as a separate dimension as per image below.
How does one show an expression as a separate dimension?

- Mark as New
- Bookmark
- Subscribe
- Mute
- Subscribe to RSS Feed
- Permalink
- Report Inappropriate Content
try to add a new dimension to your data set that is add a field "document type" associated to your document (when you load or select) and use it as dimension
- Mark as New
- Bookmark
- Subscribe
- Mute
- Subscribe to RSS Feed
- Permalink
- Report Inappropriate Content
In you script
make
Load sum(budget) as Sum_Budget from data source;
then add (Sum_Budget) into your Dimension
Hope your problem get solved
or
On Dimension tab see add calculated Dimension as sum(budget)
if you want label it
- Mark as New
- Bookmark
- Subscribe
- Mute
- Subscribe to RSS Feed
- Permalink
- Report Inappropriate Content
Hi
Thx for the reply. I've already got DocType as a dimension in the model so it's not a problem showing the sum of the values per doc type. The problem is showing the total of the budget as a dimension.
- Mark as New
- Bookmark
- Subscribe
- Mute
- Subscribe to RSS Feed
- Permalink
- Report Inappropriate Content
Could you post your document?
- Mark as New
- Bookmark
- Subscribe
- Mute
- Subscribe to RSS Feed
- Permalink
- Report Inappropriate Content
SCRIPT
Table: load 1500 as budget AutoGenerate 1;
CHART
dimension
ValueList('Invoices', 'Orders', 'Quotations', 'Budget')
expression
if(match(ValueList('Invoices', 'Orders', 'Quotations', 'Budget'), 'Invoices', 'Orders', 'Quotations'),
rand()*1000,
sum(budget)
)
![2014-03-21 23_37_14-QlikView x64 - [C__Users_mgrossi_Desktop_Z.qvw_].png](/legacyfs/online/55614_2014-03-21 23_37_14-QlikView x64 - [C__Users_mgrossi_Desktop_Z.qvw_].png)
- Mark as New
- Bookmark
- Subscribe
- Mute
- Subscribe to RSS Feed
- Permalink
- Report Inappropriate Content
Hi Sunil
My script looks like this
SALES:
Load
Date(DocDate) as DocDate,
FinncPriod,
ObjType,
slpcode,
slpname,
Turnover;
SQL SELECT Branch,
DocDate,
FinncPriod,
ObjType,
slpcode,
slpname,
Turnover
FROM dbo."XBI_SalelinesNew";
Concatenate
Load
Budget as Target,
Fincpriod as FinncPriod,
Name as slpname,
SlpCode as slpcode
;
SQL SELECT Budget,
Fincpriod,
Month,
Name,
SlpCode,
"U_Year"
FROM dbo."XBI_SalesBudgetIncludingEmpCode";
All goes well up tp here.
I then want to do your suggestion 'Load sum(budget) as Sum_Budget from data source' to make a new dimension so -
BudgetTotals:
Load
slpcode,
Sum(Target) as TargetDimension
Resident SALES;
Then I get this error
Invalid expression
BudgetTotals:
Load
slpcode
Sum(Target) as TargetDimension
Resident SALES;
I can't see where I'm making the error?
- Mark as New
- Bookmark
- Subscribe
- Mute
- Subscribe to RSS Feed
- Permalink
- Report Inappropriate Content
I noticed that
you are making "Budget as Target" field leave as it is Budget then use like below
BudgetTotals:
Load
slpcode
Sum(Budget ) as TargetDimension
Resident SALES;
or
you can directly use Sum(Budget ) in your calculated dimension these not make any difference
- Mark as New
- Bookmark
- Subscribe
- Mute
- Subscribe to RSS Feed
- Permalink
- Report Inappropriate Content
Hi Massimo
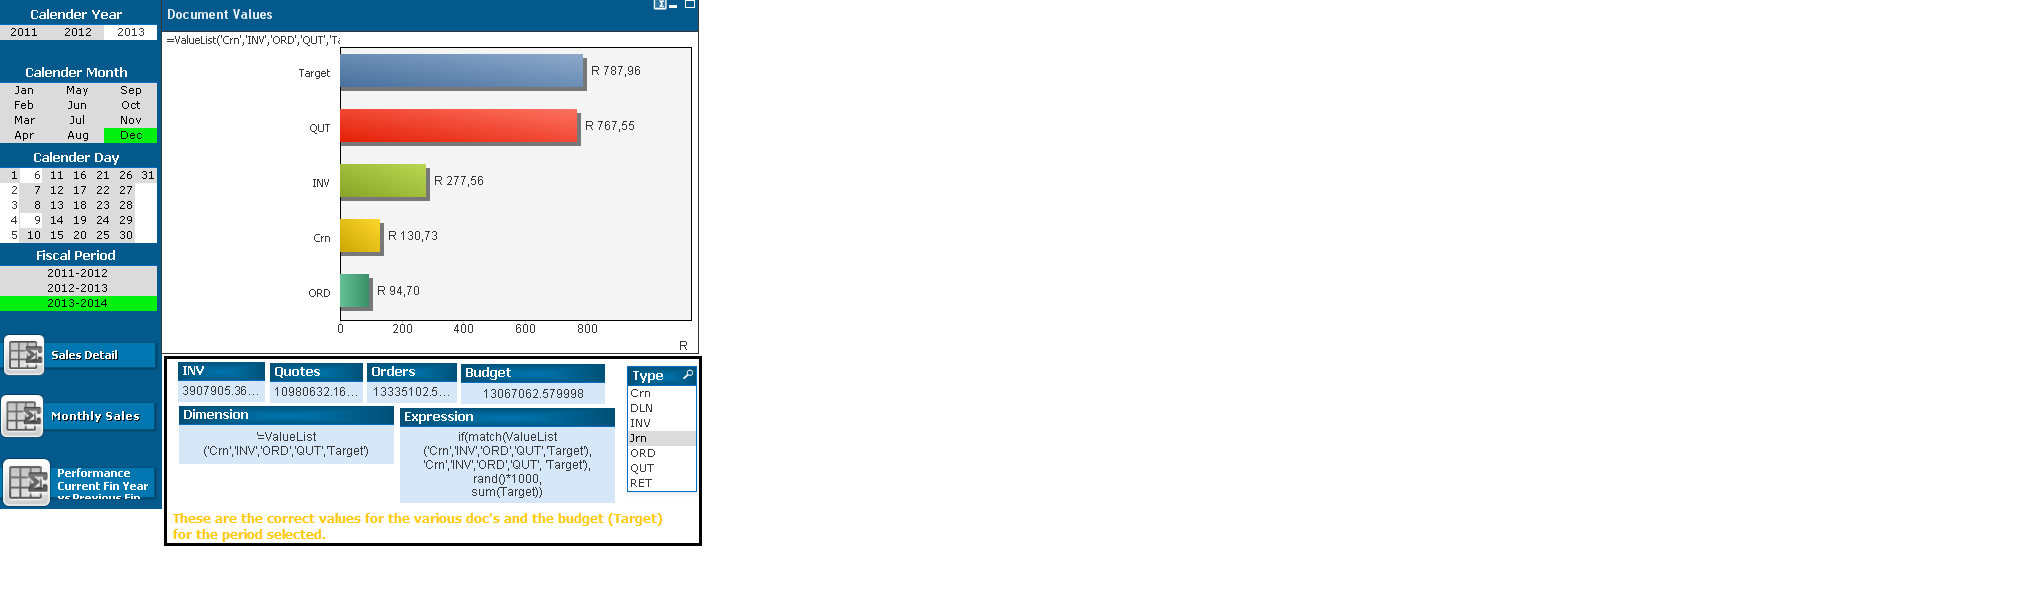
Thx for the reply - I'm getting close now but my totals in the chart is wrong - probably something small. See image below - I've added the correct values in text boxes below. When I implement your suggestion - Am I not getting budget (target) amounts per doc type and the total budget (target) as a separate column? What I need is the turnover
sum(Turnover) per doc type and the Sum(Target) as separate column like in your chart. The chart looks exactly like I want it - it's just the totals that are incorrect.