Unlock a world of possibilities! Login now and discover the exclusive benefits awaiting you.
- Qlik Community
- :
- All Forums
- :
- QlikView App Dev
- :
- Re: For every day a stacked bar of 100%
- Subscribe to RSS Feed
- Mark Topic as New
- Mark Topic as Read
- Float this Topic for Current User
- Bookmark
- Subscribe
- Mute
- Printer Friendly Page
- Mark as New
- Bookmark
- Subscribe
- Mute
- Subscribe to RSS Feed
- Permalink
- Report Inappropriate Content
For every day a stacked bar of 100%
Hello,
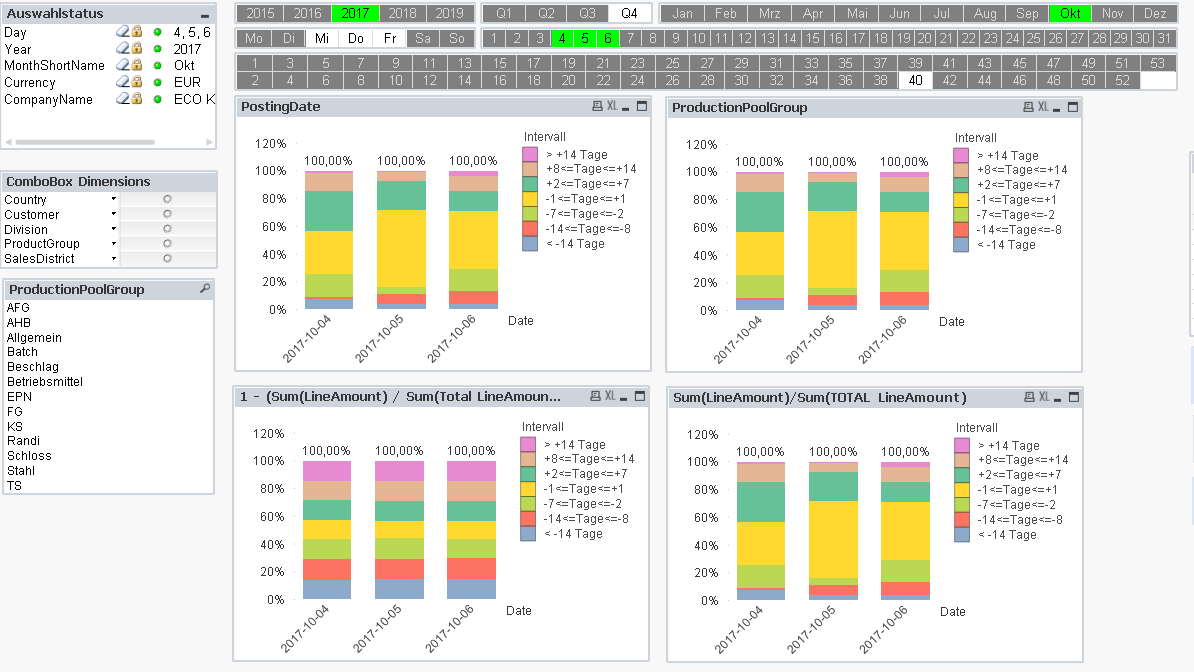
I am looking for a stacked barchart where every bar is always 100%.
I have added a example.
My example has 4 Barcharts: In every chart I have two dimensions:
Date (from my main Calendar)
DescriptionRequested which is a table with intervals.
The expressions in the charts are :
Chart 01: = Sum(LineAmount) / Sum(Total <PostingDate> LineAmount)
Chart 02: = (Sum(LineAmount) / Sum(Total <ProductionPoolGroup> LineAmount) )
Chart 03: = 1 - (Sum(LineAmount) / Sum(Total LineAmount) )
Chart 04: = Sum(LineAmount)/Sum(TOTAL LineAmount)
I have set on the relative option so that I get max 100%.
I found these expressions when I searched community.qlik.com. But I didn’t found what I was looking for.
When I select one day my bar has 100%
When I select more than one day the 100% is spread over the days, the sum is still 100%. What I want is that no matter how many days I select, every bar should be 100%.
I think it has to do with Total LineAmount which is calculated for all the selected days and then divided per Interval over the selected days. I think that the Total LineAmount should also be calculated per day, that is why I hoped Sum(LineAmount) / Sum(Total <PostingDate> LineAmount) was the solution, but it was not.
So now the question is: how do I do that, how should I change the expression to get the wanted bars with every day 100%?
Hope someone has a suggestion or the solution for me
Thanks in advance
Regards
Accepted Solutions
- Mark as New
- Bookmark
- Subscribe
- Mute
- Subscribe to RSS Feed
- Permalink
- Report Inappropriate Content
- Mark as New
- Bookmark
- Subscribe
- Mute
- Subscribe to RSS Feed
- Permalink
- Report Inappropriate Content
Try the attached
- Mark as New
- Bookmark
- Subscribe
- Mute
- Subscribe to RSS Feed
- Permalink
- Report Inappropriate Content
Thanks Sunny,
- Mark as New
- Bookmark
- Subscribe
- Mute
- Subscribe to RSS Feed
- Permalink
- Report Inappropriate Content
No problem at all 
I would suggest you to mark the appropriate answer as correct instead of marking your own response as correct above .
Best,
Sunny