Unlock a world of possibilities! Login now and discover the exclusive benefits awaiting you.
- Qlik Community
- :
- All Forums
- :
- QlikView App Dev
- :
- Force scale on a bar chart
- Subscribe to RSS Feed
- Mark Topic as New
- Mark Topic as Read
- Float this Topic for Current User
- Bookmark
- Subscribe
- Mute
- Printer Friendly Page
- Mark as New
- Bookmark
- Subscribe
- Mute
- Subscribe to RSS Feed
- Permalink
- Report Inappropriate Content
Force scale on a bar chart
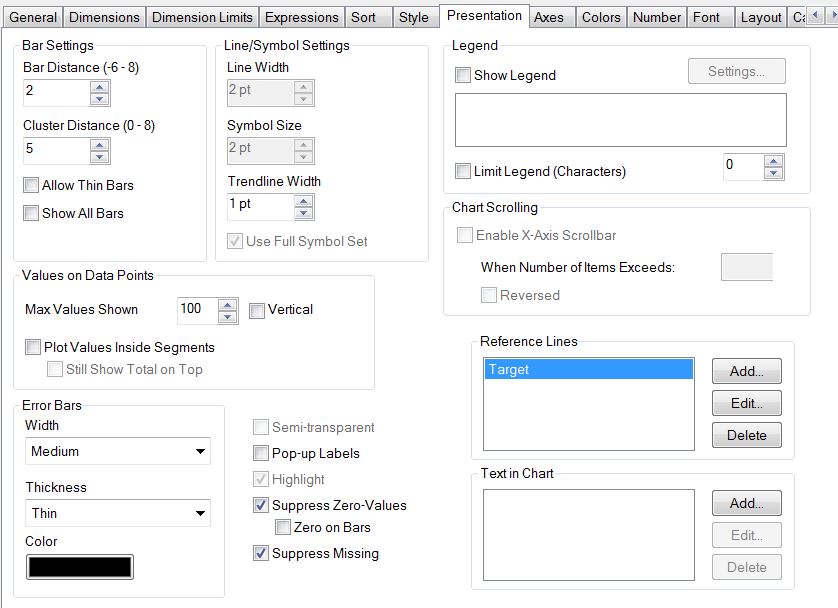
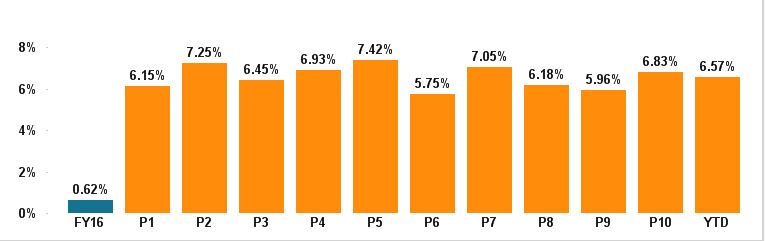
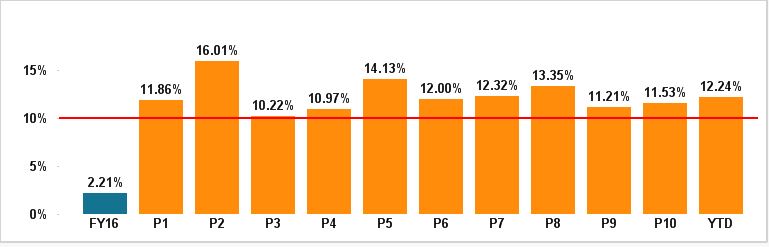
I have a bar chart with a reference line to represent a target. However, when my values are below the target line value, the target line is no longer shown. How can I force the scale to always show my reference line no matter what the other values are?
- Mark as New
- Bookmark
- Subscribe
- Mute
- Subscribe to RSS Feed
- Permalink
- Report Inappropriate Content
On the Axis tab, you can set "Static Max" to force the top end of the scale. You can use an expression to make the max dynamic, for example. to never go below the reference line, but to go higher if higher values are present. Assume Sales by Product with a ref line at 10k.
=RangeMax(10000, max(aggr(sum(Sales), Product)))
-Rob
- Mark as New
- Bookmark
- Subscribe
- Mute
- Subscribe to RSS Feed
- Permalink
- Report Inappropriate Content
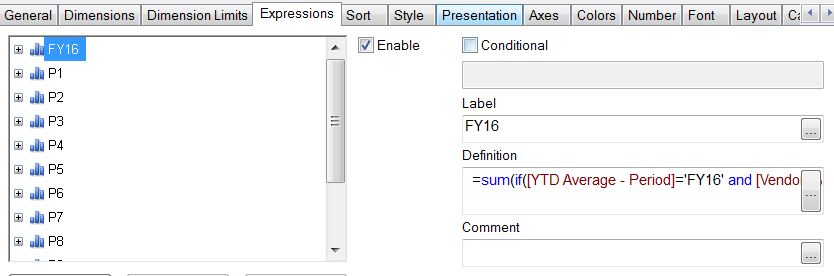
My issue is that each line on the bar chart represents it's own expression. How do I make the scale work for each expression?
- Mark as New
- Bookmark
- Subscribe
- Mute
- Subscribe to RSS Feed
- Permalink
- Report Inappropriate Content
Do you mean you have multiple reference lines? Can you post a picture?
-Rob
- Mark as New
- Bookmark
- Subscribe
- Mute
- Subscribe to RSS Feed
- Permalink
- Report Inappropriate Content
No, just one reference line. The target remains the same. Maybe there's a better way to do it?