Unlock a world of possibilities! Login now and discover the exclusive benefits awaiting you.
- Qlik Community
- :
- All Forums
- :
- QlikView App Dev
- :
- Re: Funnel Chart Idea
- Subscribe to RSS Feed
- Mark Topic as New
- Mark Topic as Read
- Float this Topic for Current User
- Bookmark
- Subscribe
- Mute
- Printer Friendly Page
- Mark as New
- Bookmark
- Subscribe
- Mute
- Subscribe to RSS Feed
- Permalink
- Report Inappropriate Content
Funnel Chart Idea
Hi,
I want to create a funnel chart as follows...
If in a sheet of data, the occurance of 'A' is less than 5, It categorizes him in LOW group. If Occurance of A > 5, it categorizes him in HIGH group.
I have a set of data having more than 200 rows and 15 distinct values in it. I want in that way.
I tried applying few logics in mind but I didn't find a way. I know a bit about set analysis but we can't directly apply search criteria on constant ( not a right logic )
Logic what I think is -
1 - Filter out distinct value from the set of values
2 - Store those values in a single variable (or array / or container / or SQL IN alike thing)
3 - Apply that variable in the final set analysis logic to just get the distinct values.
4 - COUNT the total number of values we got for a particular distinct value.
5 - Apply some sort of If...else command to satisfy the need.
This lenghty logic may solve my requirement but I m not able to figure out how to write those in QlikView. Or maybe there could be an easier or convenient way of doing the same.
Please enlighten me on this case.
If you guys need sample data, I can give it to you.
- « Previous Replies
- Next Replies »
Accepted Solutions
- Mark as New
- Bookmark
- Subscribe
- Mute
- Subscribe to RSS Feed
- Permalink
- Report Inappropriate Content
Hi
Try following
//-------------Script------------//
Data:
LOAD [A Number],
[B Number],
Charge,
[Call Duration]
FROM
(ooxml, embedded labels, table is Sheet1);
Group:
load
if(count([B Number]) = 0,'None',
if(count([B Number]) > 0 and count([B Number]) <= 5 ,'Low',
if(count([B Number]) > 5 and count([B Number]) <= 10 ,'Medium',
if(count([B Number]) > 10 and count([B Number]) <= 15 ,'High','Very High'
)))) as Grp,
[A Number]
Resident Data group by [A Number];
Thanks
- Mark as New
- Bookmark
- Subscribe
- Mute
- Subscribe to RSS Feed
- Permalink
- Report Inappropriate Content
Hi,
Is there anyone to guide me ?
--------------------------------------------------------------------------------
A_Num, B_Num, Call Dur, Charge/Sec.
2, 21, 1234, 1.2
3, 31, 2314, 1.2
2, 23, 1111, 1.2
-----------------------------------------------
1 - count (distinct A_Num) [Result 2,3]
2 - Select * from xyz where A_Num IN (2), same with 3
3 - Count the total rows with respect to 2 and 3
4 - If Count (result of 3) > 1 then group = High.
-----------------------------------------------------------------------------------------------------------------
Thanks
- Mark as New
- Bookmark
- Subscribe
- Mute
- Subscribe to RSS Feed
- Permalink
- Report Inappropriate Content
Hi sachin,
I think it would be easier to get a sample of your data and an examplanatory table of your demanded output.
But I guess your problem can be solved in the load script. Regarding to your 3 row long sample data above the script could look like this:
CalcBas:
LOAD A_Num,
B_Num,
[Call Dur],
[Charge/Sec.],
if(A_Num>2,'High','Low') as Group
FROM
test.xlsx
(ooxml, embedded labels);
Join Load
count (B_Num) as Counted_B_Num
Resident CalcBas;
...and the output would be the following: 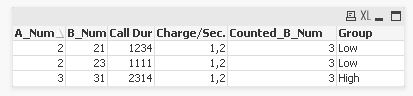
- Mark as New
- Bookmark
- Subscribe
- Mute
- Subscribe to RSS Feed
- Permalink
- Report Inappropriate Content
Hi.
You are somewhat right maybe I was not clear about my problem.
In your if statement, you are basically filtering numbers on the basis of values in A_Num. But I want to filter on the basis of occurance of values in A_Num.
Say in the above example.
A_Num has two 2's. We can treat A_num as string. So occurance of 2 is 2-times hence, it would be added to High group and so on.
Please find the attachment of sample table.
Thanks for reply .
Regards,
Sachin A.
- Mark as New
- Bookmark
- Subscribe
- Mute
- Subscribe to RSS Feed
- Permalink
- Report Inappropriate Content
Hi Sachin
As i understood i tried something and uploading here with..
Please have a look and let me know
Thnaks
- Mark as New
- Bookmark
- Subscribe
- Mute
- Subscribe to RSS Feed
- Permalink
- Report Inappropriate Content
Hi.
Thanks for reply.
What my requirement is.
Consideration
1 - A_Num is not an Integer. We suppose not to do any calculation on the value of A_Num.
Requirement.
A funnel chart, with
Dimensions as High and Low.
Expression as Count.
If count of particular value in A_num is less than 2 (or anything), goes to LOW and if higher, go to HIGH.
I hope I m clear now..
IN SHORT , we just need to create two groups High and Low based on the occurance of particular values in the A_Num
Thanks...
Waiting for response.
- Mark as New
- Bookmark
- Subscribe
- Mute
- Subscribe to RSS Feed
- Permalink
- Report Inappropriate Content
Hi Sachin,
Please have a look at the attached Document..
Hope thats what u want..
Thanks
- Mark as New
- Bookmark
- Subscribe
- Mute
- Subscribe to RSS Feed
- Permalink
- Report Inappropriate Content
In this example, you actually creating a straight table with A_Num as a Dimension and If statement as Exp. All fine here, what data I need is there perfectly but I m not getting those groups as Funnel Dimensions as there were no such column exist in the datafile. So we need to create such column in the script or chart itself and used them as a dimension in funnel chart.
- Mark as New
- Bookmark
- Subscribe
- Mute
- Subscribe to RSS Feed
- Permalink
- Report Inappropriate Content
Hi Sachin,
No Actually i have corrected it and send you the updated application which have funnel chart.
I think it happen cause i updated the same document and sent you..
I am here by sending it again with different name..
Please have a look at it
- Mark as New
- Bookmark
- Subscribe
- Mute
- Subscribe to RSS Feed
- Permalink
- Report Inappropriate Content
Thanks. Helpful.
If I have say 5 categories.
None = 0
Low = 1-5
Medium = 6-10
High = 11-15
Very High = >16
How to achieve this ?
- « Previous Replies
- Next Replies »