Unlock a world of possibilities! Login now and discover the exclusive benefits awaiting you.
- Qlik Community
- :
- All Forums
- :
- QlikView App Dev
- :
- Gantt problems
- Subscribe to RSS Feed
- Mark Topic as New
- Mark Topic as Read
- Float this Topic for Current User
- Bookmark
- Subscribe
- Mute
- Printer Friendly Page
- Mark as New
- Bookmark
- Subscribe
- Mute
- Subscribe to RSS Feed
- Permalink
- Report Inappropriate Content
Gantt problems
Hi, I succesfully implemented a Gantt using bar charts, which came out (IMHO) really awesome, with lots of functionalities
As I have about 500 Gantt's to produce, each with a varying number of activities from 1 to 150 (...), this chart can really save my life but in order to be really able to use it, I have some more problems to resolve which are:
Y axis (the calendar):
It seem I can't decide the scale of the calendar (which depends by the format of the first expression)
What I mean is that I'd like to show "qq/yy" or "mm/yy" conditionally (if the range is >1year or not).
If I work with the number format on the graphic properties, I can apply a MM/YY format, but I can't apply QQ/YY and from the properties I can't do it dinamically: is there any other way?
Report and size of the bars:
As I'll need to produce an automatic report for each project, I'll need to split the Gantt in different pages when there are too many activities (I have up to 150). I also want to preserve the size of the bars (I don't want them to be stretched when there is only one activity). I haven't seen any possibility to split charts like tables when they are too long.
- I'm thinking about creating a new field ('Ganttcount') in the load script (but really dunno how) giving a number to each activity that will represent the number of the gantt, and use to that field to cycle the chart within each project. So if I want not more than 15 activities in a gantt and I have a project with 30, the first 15 will have Ganttcount:1 and the second 15 will have Ganttcount:2. Any other suggestion?
- I'd like to fix the size of the bars (I'll never have more than 15 activities with the point above, but I'll still can have less than 15...). The only thing I could think about, is a procedure to dinamically create new fake activities during the loading script in order to always have 15 activities per gantt (so in a project with only one activity, I'll create 14 fake invisible activities).... Is this really the only solution???? It sounds so complex..
- Mark as New
- Bookmark
- Subscribe
- Mute
- Subscribe to RSS Feed
- Permalink
- Report Inappropriate Content
well, I don't know if someone can help me, I've resolved most of my problems but I still can't make the X scale to work properly and I don't really have a clue on how to fix the steps
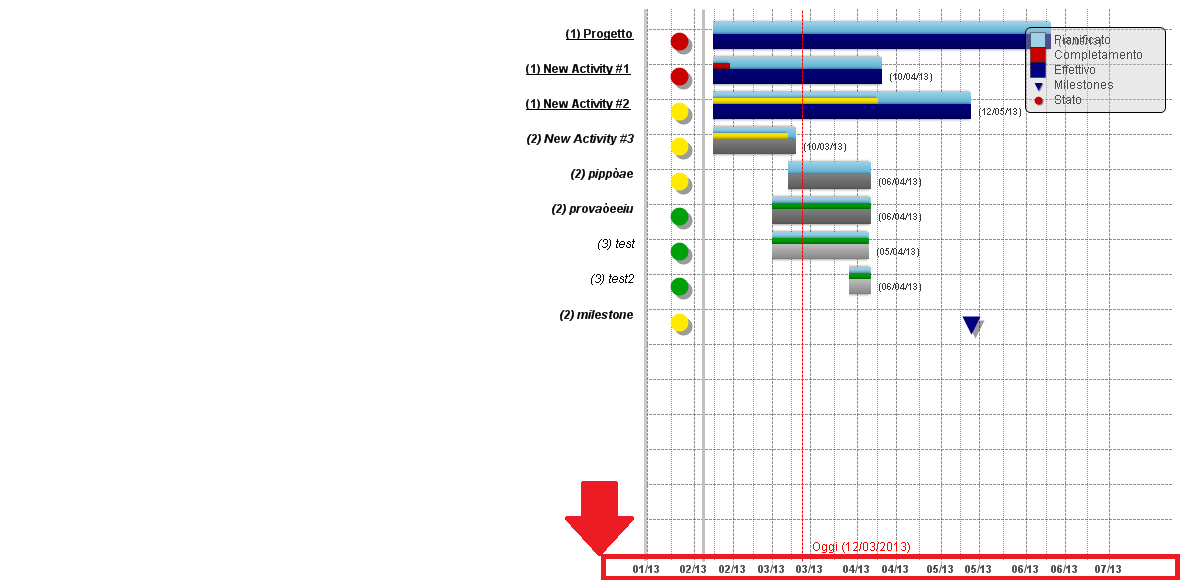
As you can see, when the scale is short (<1 year) the grid steps are so short that some labels gets repeated
The labels format comes from the number format of the first expression (which is MM/YY, althought the data itself is dd/mm/yyyy, which is why there are repetitions)
The problem is that the static step function doesn't seem to work despite all my tests:
- if I put directly a number (any number) the whole axis disappear completely (?!!!)
- If I try to define the static step with a function, there isn't an effect at all, like when the option is unchecked (which may be because my expressions are wrong of course)
what I'm trying to achieve is something like:
static steps: if(max(enddate)-min(startdate )<365, 30, 90)
and of course I'd also love some precision in the steps (the correct monthend() for each interval).
I've searched the forum and I found similar questions but I wasn't able to find/implement a solution that works here.
Someone has any suggestion please?
many thanks